The 10-year T-yield dropped from 3.24 percent a month ago to last Thursday’s intraday low of 2.83 percent. The daily chart is grossly oversold. A rally looks imminent near term, meaning TLT is headed lower.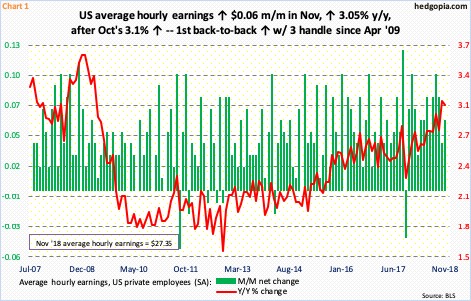
US average hourly earnings for private-sector employees rose six cents month-over-month in November to $27.35. They increased 3.05 percent year-over-year, coming on the heels of a 3.10-percent rise in October. This was the first time since April 2009 wages grew with a three handle (Chart 1).
Historically, wage growth is still subdued, but it has trended higher for at least a year now. Ordinarily, November’s back-to-back increase with a three handle should have crystallized markets’ concerns for an increasingly hawkish Fed. Not this time.
Last Friday, the two-year Treasury yield – most sensitive to markets’ expectations of the Fed’s monetary policy – fell four basis points to 2.72 percent; it peaked at 2.97 percent a month ago. The 10-year T-rate shed three basis points to 2.85 percent; it has been under pressure since touching 3.25 percent on October 5.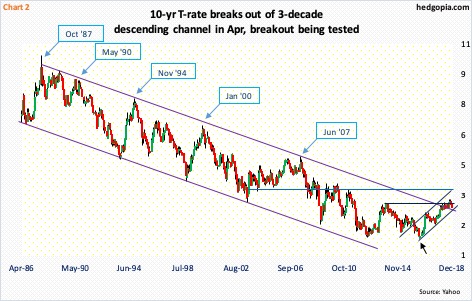
A lot has changed in just a few weeks.
Next week, the FOMC meets (18-19). The odds in the futures market for a 25-basis-point hike are currently 71.5 percent, which of late has come down, but high enough to make a hike look probable Markets will be on pins and needles as to if the dot plot shifts lower. In the prior meeting, FOMC members expected three hikes next year. Markets expected one. In recent weeks, a few members have dropped hints that the dot plot’s forecast may be a little aggressive.
By next week’s meeting, assuming the Fed hikes, the fed funds rate would have risen to 225-250 basis points, up 225 basis points since December 2015. At the same time, the 10-year has struggled to follow short rates higher. The 10s/2s spread currently stands at 13 basis points – the lowest since June 2007, and pretty close to inversion. The long end is warning the Fed not to get too tight.
Back in April, there was a lot of excitement among bond bears when the 10-year crossed three percent. This was the first time since January 2014 that these notes yielded three percent. Prior to this, yields had been trading within a three-decade-old descending channel. That breakout is currently being tested. The 10-year is also at the low end of a rising channel from July 2016 when it bottomed at 1.34 percent (arrow in Chart 2).
Near term, a rally looks to be in the cards.
Last Thursday’s intraday low of 2.83 percent also tested horizontal support going back to February this year. From the October high, the 10-year fell 42 basis points. Non-commercials expected this.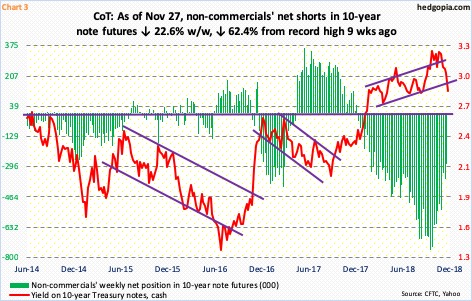
Not that these traders were net long 10-year note futures. They only actively cut back their net shorts, which by the week ended September 25 this year had swollen to 756,316 contracts, a record. Then they began to cover. By Tuesday last week, they were only net short 284,223 contracts, down 62.4 percent from the all-time high two months ago (Chart 3).
This short-covering by non-commercials must have put these notes under upward pressure, hence the drop in yields. They still hold sizable net shorts. Continued short-covering should continue to put the 10-year rate under downward pressure, a likely scenario medium- to long-term. Near-term is another matter.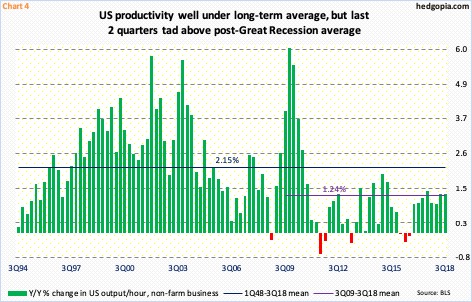
The economy is decelerating, but from a decent level. November produced below-consensus 155,000 non-farm jobs, but the monthly average in the first 11 months is 206,000, higher than last year’s monthly average of 182,000. In six months, the post-Great Recession recovery/expansion would have completed a decade. At 3.67 percent, the unemployment rate in November was at a 49-year low; in months/quarters to come, the path of least resistance is up. This is what the 10-year fears, particularly considering how anemic productivity has been this cycle.
In 3Q18, non-farm output/hour increased 1.29 percent y/y (Chart 4). This was the fastest pace in four quarters. The last time productivity grew with a two handle was eight years ago. Going all the way back to 1Q48, productivity grew 2.15 percent on average. In the current cycle, it has only managed 1.24-percent growth. Thus the difficulty for the 10-year to push toward the four handle on a sustained basis.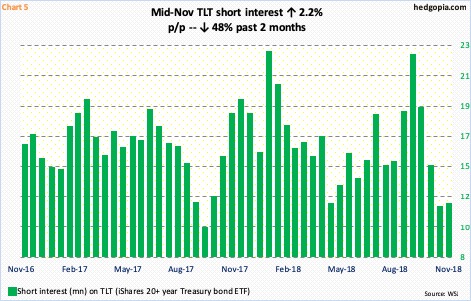
This necessitates bond bears to quickly lock in profit. As pointed out earlier, non-commercials began cutting back net shorts late September, but not before riding the rise in yields from 2.03 percent in September 2017 to the high this October, having switched to net short mid-December last year (Chart 3).
Also on TLT (iShares 20+ year Treasury bond ETF), short interest jumped to 22.7 million mid-September. By mid-November, it was down to 11.8 million. It is possible shorts covered more in the November 16-30 period (numbers will be out Tuesday), and even in the current period, as the 10-year rate continued lower.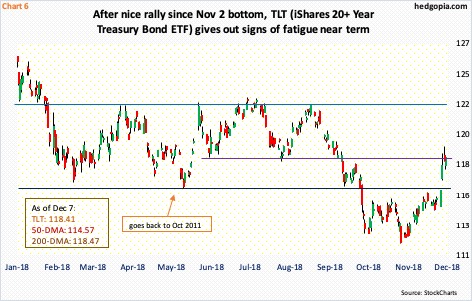
The way things are shaping up, medium- to long-term, TLT probably has a lot of upside left. Several monthly momentum indicators have just turned up. The weekly chart just developed a potentially bullish MACD crossover. The daily chart, however, is a little extended.
TLT rallied from $111.90 intraday on November 2 to last Thursday’s high of $119.20, when a shooting star showed up just outside the 200-day moving average ($118.47). Bulls would love to go test resistance at $122-50-ish, but signs of fatigue are showing up. Odds favor weakness near term. Support at $116.50-$117 goes back to October 2011 (Chart 6). As a matter of fact, if it gets there, it is a potential long. Until then, it is worth going on the sidelines.
Hypothetically on September 24, a short put was initiated, which resulted in long TLT at $116.12. The ETF closed last Friday at $118.41. Worth locking in profit.
Thanks for reading!

