
Following futures positions of non-commercials are as of December 26, 2017.
10-year note: Currently net short 83.7k, up 39.4k.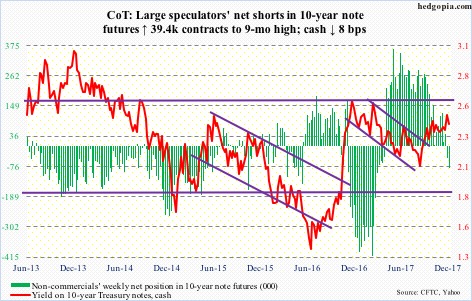
No one said a breakout of this significance would be easy.
Last week, 10-year yields closed right underneath a three-decade-old descending channel. Since hitting 2.5 percent last Thursday, yields (2.41 percent) have come under slight pressure. This was preceded by a five-session, 16-basis-point rally.
A giveback is only natural. Bond bears hope that in the worst case yields drop to the the nearest support – the 50-day moving average at 2.38 percent, for instance – and they are able to defend it. They can then launch another attack on the said resistance. Inability to put their foot down, however, can open up an opportunity for the bulls.
The weekly chart – in overbought territory – has a lot of unwinding left. Should it unfold, a rising trend line from July last year, when yields reached historic lows of 1.34 percent, draws to 2.22 percent. The 200-day (2.3 percent) would have been lost by then.
30-year bond: Currently net long 84.8k, down 19.6k.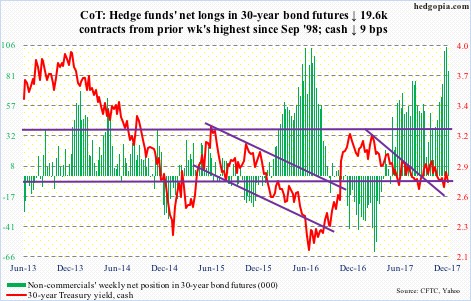
Major economic releases next week are as follows. Happy New Year!
Wednesday brings the ISM manufacturing index (December) and FOMC minutes for the December 12-13 meeting.
Manufacturing activity in November fell five-tenths of a point month-over-month to 58.2. September’s 60.8 was the highest since 61.4 in May 2004.
The employment report (December), durable goods (November, revised) and the ISM non-manufacturing index (December) are due out Friday.
November produced 228,000 non-farm jobs. This puts the monthly average year-to-date at 174,000, which compares rather poorly with the monthly average all of last year of 187,000. In fact, job creation has been decelerating for a while now, with the monthly average in 2015 of 226,000 and 250,000 in 2014.
Preliminarily, November orders for non-defense capital goods ex-aircraft – proxy for business capital expenditures – jumped 8.1 percent year-over-year to a seasonally adjusted annual rate of $67.1 billion. On the surface, this looks very healthy, but belies underlying weakness. Orders peaked at $70.3 billion in September 2014, later bottoming at $59.9 billion in May 2016. Numbers were still suppressed one year ago.
Services activity declined 2.7 points m/m in November to 57.4. October’s 60.1 was the highest ever (data only goes back to January 2008).
Crude oil: Currently net long 665.6k, up 28.7k.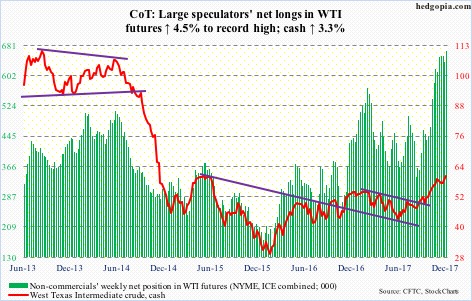
Momentum begets momentum.
Oil bulls enjoyed another mini-breakout on spot West Texas Intermediate crude ($60.42/barrel) – out of $59. The week’s high of $60.51 was the highest since June 2015. Back then, the crude went sideways for several weeks around this level before coming under sustained pressure.
For now, momentum is with the bulls. In all sessions this week, the crude closed on and around the daily upper Bollinger band. Nonetheless, this is not easy to sustain. A test of $59 – and/or the 10- and 20-day ($58.69 and $57.96, respectively) – is possible near term.
The EIA report for the week of December 22 – out Thursday – further fuelled the bullish sentiment.
Crude stocks continued to decline – down another 4.6 million barrels to 431.9 million barrels. This was the lowest since October 2015.
For a change, crude production fell – down 35,000 barrels per day to 9.75 million b/d. Since OPEC and Russia reached a deal in November last year to cut production by 1.8 mb/d, U.S. production has gone up by 1.06 mb/d.
Refinery utilization rose 1.6 percentage points to 95.7 percent. This was the highest since the pre-hurricane high of 96.6 percent in the week ended August 25.
Gasoline and distillate stocks, on the other hand, rose – up 591,000 barrels and 1.1 million barrels to 228.4 million barrels and 129.9 million barrels, respectively.
E-mini S&P 500: Currently net long 104.7k, up 21.5k.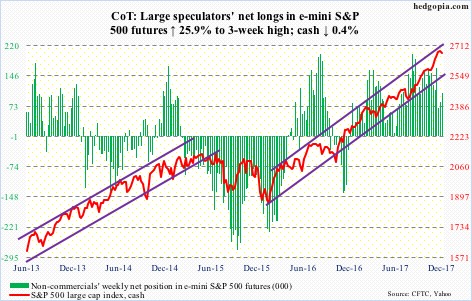
Market participants cannot seem to make up their mind. A week after pulling $22.2 billion out of U.S.-based equity funds (including ETFs), they sent in $24.1 billion in the week through Wednesday (courtesy of Lipper).
In the same week, S&P 500-focused ETFs continued to attract funds. SPY (SPDR S&P 500 ETF) took in $2.5 billion – $23.7 billion in the last four – while $345 million moved into VOO (Vanguard S&P 500 ETF). IVV (iShares core S&P 500 ETF) lost $26 million (courtesy of ETF.com).
For the week, the cash was down 0.4 percent – first down week in six. The 10-day was lost Friday. Volume tends to be very low around this time of the year, so it is hard to read too much into this. That said, momentum may have shifted the bears’ way near term.
Euro: Currently net long 92.1k, up 5.9k.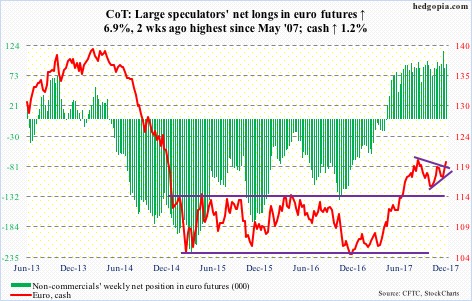
Euro bulls were able to push past a falling trend line from September 8 this year, but rather unconvincingly. The weekly candle looks solid – up 1.2 percent – but on the daily all four sessions ended with long wicks, with Friday closing well outside the daily upper Bollinger band.
In September, the cash ($120.05) retreated after hitting $120.69. Resistance around that level goes back nearly two decades, and will test the bulls’ mettle.
Gold: Currently net long 135.9k, up 22.2k.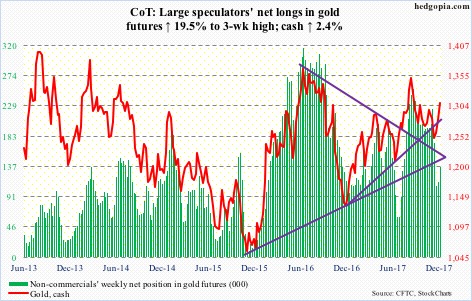
It has been quite a rally. From $1,238.30/ounce 13 sessions ago, the cash ($1,309.30) Friday took out resistance at $1,300, which goes back several years.
The weekly chart has room to continue higher. The daily chart is extended. One possible path: the metal retreats, but finds support at the $1,260-$1,270 level, where there is a confluence of moving-average support.
All the better if flows improve. In the week to Wednesday, GLD (SPDR gold ETF) took in $60 million, but IAU (iShares gold trust) lost $40 million (courtesy of ETF.com).
Nasdaq 100 index (mini): Currently net long 2.9k, down 1.2k.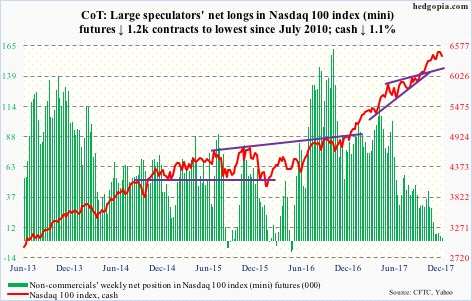
For the first time in five weeks, QQQ (PowerShares QQQ trust) attracted money – inflows of $1.8 billion, versus loss of $3 billion in the prior four (courtesy of ETF.com).
This was still not sufficient to stop the downward momentum that began last week after the cash (6396.42) peaked at 6522.70 on the 18th. Non-commercials continue to adopt a cautious approach.
The bulls have lost the 10-day, closing out the week right on the 20-day.
Near- to medium-term, the path of least resistance is probably down. This likely brings some relief to XLK (SPDR technology sector ETF) shorts, who have doggedly remained aggressively short. But this very fact can ultimately help the bulls as the shorts cash in and cover.
Russell 2000 mini-index: Currently net long 50.2k, up 529.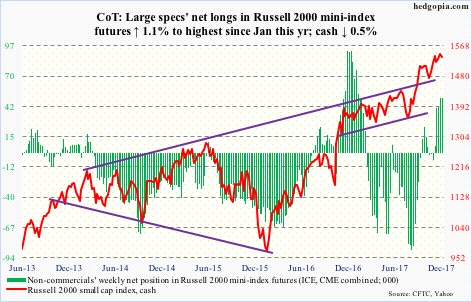
The cash (1535.51) has gone sideways the past five weeks. Unlike its large-cap peers, it did not make a new high since peaking on the 4th this month at 1559.61, but at the same time has not fallen apart. Breakout retest of 1515 two weeks ago was successful. A test of that support – now approximated by both the 50-day and the daily lower Bollinger band – is likely near term.
For whatever it is worth, small-caps’ sideways action comes amidst continued buildup in margin debt, which rose $19.5 billion m/m in November to $580.9 billion – a new record.
The problem is, non-commercials are already aggressively net long. And flows are not cooperating.
In the week through Wednesday, IWM (iShares Russell 2000 ETF) lost $300 million – $3.1 billion in the last three – even as IJR (iShares core S&P small-cap ETF) took in $50 million (courtesy of ETF.com).
US Dollar Index: Currently net long 2.5k, down 1.4k.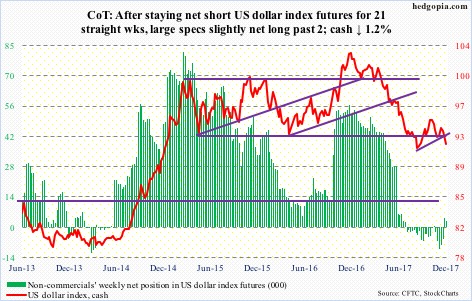
From the daily upper Bollinger band to past the lower in 13 sessions – from an intraday high of 94.21 to 91.83. The cash just lost range support at 92-93.
For a change last week, non-commercials went net long. This week, they cut back – although still slightly net long. They continue to show disinterest.
If the weekly chart prevails, there is room for the dollar index to continue lower. The September 8th low of 90.99 has taken on significance.
VIX: Currently net short 97.1k, down 31.5k.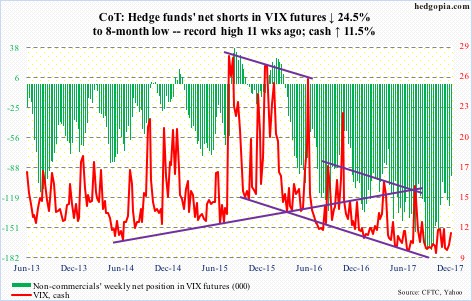
Friday’s 8.5-percent rally put the cash (11.04) well beyond the 50-day (10.44) and just past the 200-day (10.96).
In the recent past – mid-November and early this month – spikes in VIX went well past the daily upper Bollinger band (11.63), and then peaked.
In the options market, the 21-day moving average of the CBOE put-to-call ratio on Thursday dropped to 0.57, which was the lowest since July 2014. In the last 29 sessions, the ratio registered readings of 0.50s in 21, with six in low-0.60s and two in mid- to high-0.60s.
Put another way, there is plenty of room for unwinding. Ditto with the VIX-to-VXV ratio, which, after remaining languished in oversold territory for four months, rose Friday to 0.843, but can continue to rise should demand for near-term protection rises.
Thanks for reading!
