Following futures positions of non-commercials are as of November 15, 2016.
10-year note: Post-Trump victory, the bond market has swiftly priced in higher inflation. The U.S. economy is in its eighth year of expansion, although growth remains subdued.
On a 12-month rolling total basis, the federal deficit has been rising since January this year – from $405.3 billion to $587.4 billion in September. In the past, deficit was as high as $1.5 trillion in February 2010. As a result, issuance of Treasury notes and bonds peaked at $1.7 trillion in June that year. Last month, issuance was $476 billion.
If president-elect Trump succeeds in pushing through his big infrastructure spending plan, deficit in all probability will continue to rise, which then means more Treasury issuance. The 5-year, 5-year inflation expectation rate – up from 1.89 percent on November 8 (election day) to 2.06 percent two sessions later, before backing off to two percent – is sniffing inflation.
The rub in all this is debt. Federal debt stood at $19.4 trillion in 2Q16; interest payments were at a seasonally adjusted annual rate of $471.7 billion – about on par with $456.6 billion five years ago. Between the periods, debt went up by $5 trillion; the 10-year yield, however, went from 3.2 percent to 1.5 percent, which made all the difference insofar as interest payments were concerned.
The 10-year yield bottomed at 1.34 percent on July 6 this year, closing the week at 2.34 percent – up 100 basis points in four months. In 2Q16, as a share of federal debt, interest payments comprised 2.43 percent. Simplistically, if we add 100 basis points to this, 2Q16 interest payments would have gone up by $193 billion.
The debt load is simply too big – and heading higher – for markets to allow a persistent rise in interest rates without substantially hurting the economy.
Currently net long 137.4k, up 209.1k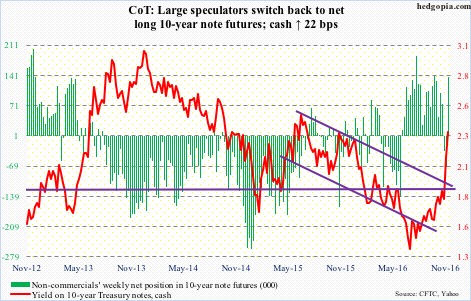
30-year bond: Major economic releases next week are as follows. It is a holiday-shortened week. Happy Thanksgiving!
Existing home sales for October are published on Tuesday. September rose by 3.2 percent month-over-month to a seasonally adjusted annual rate of 5.47 million units. The cycle high was reached in June this year at 5.57 million – the highest since 5.79 million in February 2007.
Wednesday brings durable goods orders (October, advance); new home sales (October); the University of Michigan’s consumer sentiment (November, final); FOMC minutes (November 1-2 meeting).
Orders for non-defense capital goods ex-aircraft – proxy for business capital expenditures – fell by 1.3 percent m/m in September, and by 4.3 percent year-over-year. This was the 11th consecutive y/y contraction – and 20th in the last 21 months.
September sales of new homes were up 3.1 percent m/m to a seasonally adjusted annual rate of 593,000 units. July’s 629,000 units were the highest since 641,000 in November 2007.
Preliminarily, consumer sentiment rose 4.4 points in November to a five-month high 91.6. The cycle high was reached in January last year at 98.1 – an 11-year high.
Currently net short 3.9k, up 1.2k
Crude oil: Support at $43-plus, which goes back to January 2015, was tested again this week. In fact, spot West Texas Intermediate crude intra-day Monday penetrated that support before closing at $43.32/barrel. That long-legged doji/spinning top session was followed by a 5.7-percent rally on Tuesday. Wednesday’s rally attempt was rejected at support-turned-resistance $46-plus, which oil bulls need to conquer for continued momentum – ended the week right on that price point.
The EIA report out on Wednesday was not viewed positively in the oil pit. Stocks rose across the board.
Crude inventory rose by 5.3 million barrels to 490.3 million barrels – an 11-week high. Stocks have gone up by 22.2 million barrels in the past three weeks.
Gasoline stocks increased by 746,000 barrels to 221.7 million barrels, and distillate stocks by 310,000 barrels to 148.9 million barrels. In the prior week, gasoline stocks were the lowest since mid-December last year, and distillates the lowest since early December last year.
Crude imports also rose by 981,000 barrels per day to 8.4 million b/d.
Refinery utilization rose by 2.1 percentage points to 89.2 – a seven-week high.
Crude production fell by 11,000 b/d to 8.7 mb/d.
Technically, there is room for spot WTI to rally near term. Let us see if oil bulls can pull it off.
Currently net long 273.3k, up 30.4k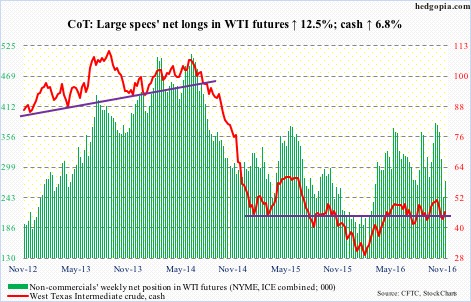
E-mini S&P 500: Bulls for sure hope SPY, the SPDR S&P 500 ETF, continues the trend of the past couple of weeks. In the week ended Wednesday, it attracted $7.1 billion. This came in the wake of inflows of $5.5 billion in the prior week (courtesy of ETF.com).
More importantly, in the same week, a rather massive $23.6 billion moved into U.S.-based equity funds (courtesy of Lipper). This essentially offset the cumulative outflows of the prior four weeks.
By Wednesday, these inflows were just enough to push the S&P 500 index (cash) to test last week’s high, not to a record high, as was the case with the Dow Industrials, by the way. In a doji session on Monday, the latter rose to a new high of 18934.05. On the S&P 500 index, the August 15th record high of 2193.81 remains.
Just looking at the S&P 500’s weekly chart, there is room for it to grind still higher. But the daily chart is way extended, with signs of fatigue beginning to show up.
Currently net short 13.9k, up 10.6k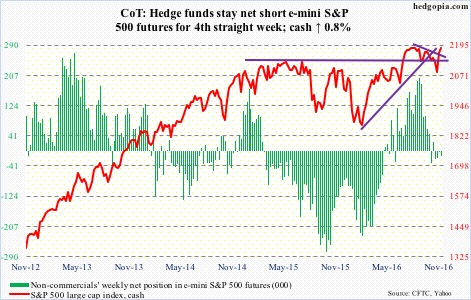
Euro: The downward momentum continued on the cash, with Monday a gap-down. The slightly rising trend line from March last year has been lost.
Since it was rejected at just under its 200-day moving average on November 4 at 111.5 through the Friday low, the euro lost 5.2 percent. The daily RSI is sub-30, dipping to 21.49 on Friday. Way oversold, and a bounce is probably due, but needs to stabilize first.
Currently net short 119.2k, down 10.1k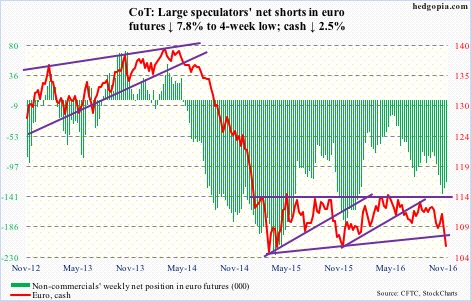
Gold: The metal has been through a lot in the last five weeks – first a loss of $1,300-plus support on October 4, followed by loss of 50- and 200-day moving averages as well as a slightly rising trend line from October 7.
Flows are not helping. In the week ended Wednesday, GLD, the SPDR gold ETF, lost $1.2 billion, as opposed to inflows of $419 million in the prior week (courtesy of ETF.com).
There is support at $1,180-$1,200, the upper end of which was tested three times this week. On a daily basis, momentum indicators are grossly oversold.
Currently net long 177.7k, down 39.6k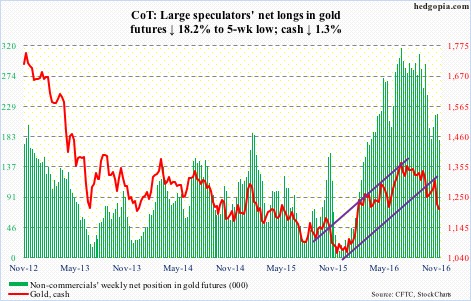
Nasdaq 100 index (mini): In the week through October 25, non-commercials held 162,662 net longs – a record. The Nasdaq 100 (cash) peaked on that very day. In the next nine sessions, the index lost 5.4 percent. Net longs have been drastically cut.
The tech-heavy index was also one of the sectors to take a hit post-election. In the week through Wednesday, QQQ, the PowerShares Nasdaq 100 ETF, only attracted $126 million – not much relative to the amount that moved into SPY and IWM, the iShares Russell 2000 ETF. This followed outflows of $1 billion in the prior week (courtesy of ETF.com).
The cash rallied 1.2 percent this week, but faced resistance at 4840. Near-term path of resistance is probably down.
Currently net long 71.4k, down 30.2k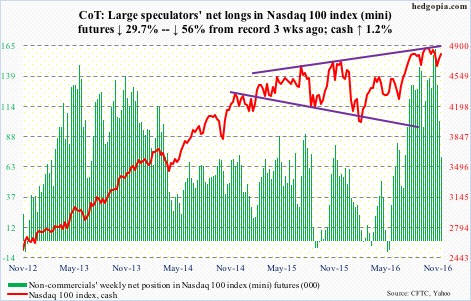
Russell 2000 mini-index: Better late than never! After lagging large-cap brethren for a long time, small-caps finally came to life. The Russell 2000 small-cap index Monday surged past the June 2015 high of 1296 to a new all-time high. Friday further built on this, with an intra-day high of 1316.22.
Off the November 3rd low through the Friday high, the Russell 2000 rallied nearly 14 percent in 11 sessions – nearly 10-plus percent post-election. Unreal!
Flows are cooperating. In the week ended Wednesday, IWM gained $4.5 billion. This came on the heels of $1.3 billion in inflows in the prior week.
Investors/traders are piling on on the belief that the Trump administration would enact growth-oriented policies. Small-caps inherently have high domestic exposure. A lot is in the price already. Those expectations better come through.
Currently net long 19.8k, up 38.8k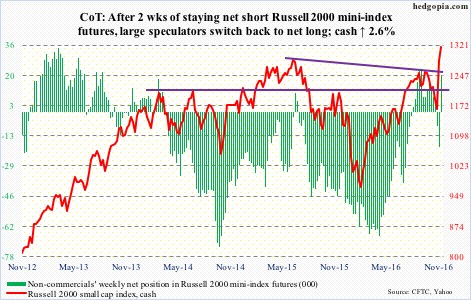
US Dollar Index: From election day (Nov 8) through the Friday high, the cash rallied 3.8 percent – and just under 10.5 percent from the May 2016 low. That is a lot.
On Friday, it rose to to 101.54 – the highest since March 2003 – breaking out of horizontal resistance dating back to March 2015. The daily chart is grossly overbought, but is yet to flash a sign of fatigue.
Importantly, non-commercials’ net longs in US dollar index futures are nowhere near what they had when the cash peaked in March 2015. The rally lacks their vote of confidence.
The sharp rally in due course is bound to have adverse implications for U.S. exports, and by default, corporate earnings. Markets are currently oblivious to this. Plus, longer term, the dollar can enjoy another tailwind should the Trump administration allows U.S. corporations to repatriate profits held overseas.
Currently net long 48.4k, down 3.9k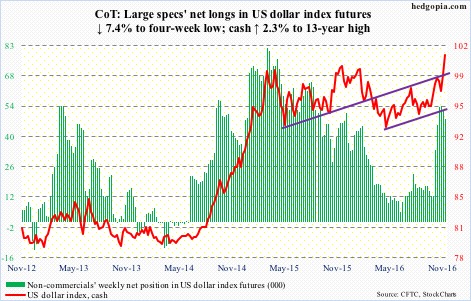
VIX: The cash dipped below 13 on both Thursday and Friday.
The VIX-to-VXV ratio, at 0.83 on Friday, has now dropped into oversold zone – high 0.70s to low-0.80s.
In the meantime, the volatility curve has gone from steep backwardation early this month to steep contango – similar to how it looked late May and early September this year. Both those instances preceded pullbacks in stocks.
Currently net short 49.2k, down 711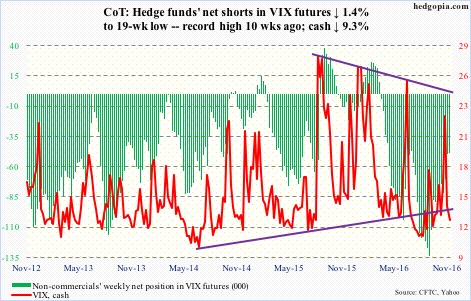
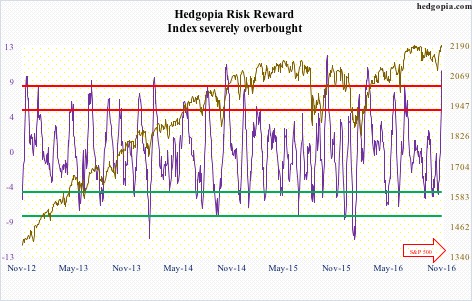
Hedgopia Risk Reward Index