
Following futures positions of non-commercials are as of April 30, 2019.
10-year note: Currently net short 287.9k, down 35.9k.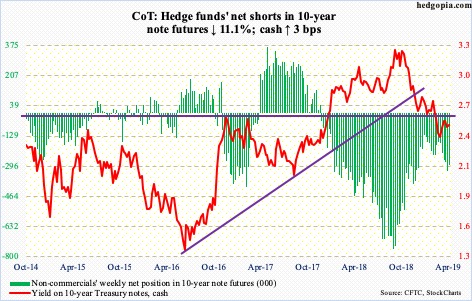
The FOMC met this week. Markets were hoping that the Fed would deliver a dovish message. It didn’t. As expected, the fed funds rate was left unchanged at a target range of 225 to 250 basis points. Going into this, hopes were building that the central bank would react to falling inflation by signaling a rate cut later this year. Both core CPI and core PCE have trended lower since last July, with the latter – the Fed’s favorite measure of consumer inflation – up a mere 1.55 percent in March. The bank aims at two percent.
In a post-meeting press conference Wednesday, Jerome Powell, Fed chair, said this is a transitory phenomenon and that he expects inflation to move back up. In other words, no rate cuts are in the cards, not anytime soon. The 10-year Treasury yield (2.53 percent) rallied three basis points for the week.
It is too soon to declare if this marks a definitive shift in trader sentiment. The 10-year made a low of 2.36 percent on March 27. The subsequent rally was rejected at 2.61 percent mid-April. Support-turned-resistance at 2.62 percent is a crucial level going back a decade. Unless bond bears retake this level, squeeze risks at some point in the future remain. Non-commercials have built up a decent amount of net shorts in 10-year note futures.
30-year bond: Currently net short 38.1k, down 2k.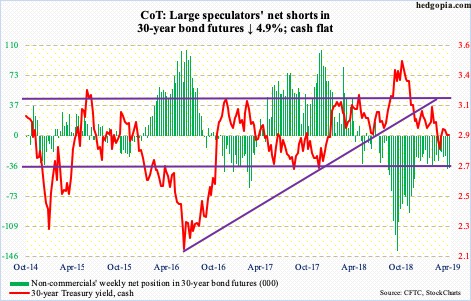
Major economic releases next week are as follows.
Job openings (JOLTS) for March are scheduled for Tuesday. Non-farm openings in February dropped 538,000 month-over-month to 7.1 million. January’s total essentially tied with last November’s record high 7.6 million.
Thursday brings PPI for April. Producer prices in March increased 0.6 percent m/m and 2.2 percent year-over-year; core PPI was unchanged m/m and rose two percent y/y.
April’s CPI is on tap Friday. In March, consumer prices rose 0.4 percent m/m and 1.9 percent y/y. Core CPI over the same time period increased 0.1 percent and two percent respectively.
Crude oil: Currently net long 632.1k, down 27.7k.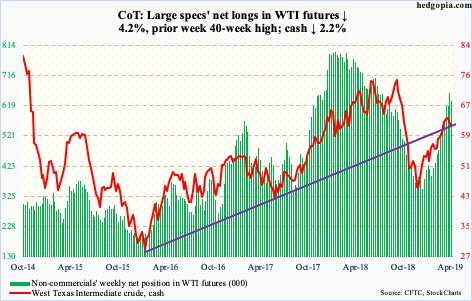
US crude production in the week to April 26 increased 100,000 barrels per day to 12.3 million bpd – yet another record. Crude imports, too, rose – up 265,000 bpd to a 10-week high of 7.4 mbpd. As did crude and gasoline stocks. The former jumped 9.9 million barrels to 470.6 million barrels – the highest since September 2017 – while the latter rose 917,000 barrels to 226.7 million barrels. Refinery utilization fell nine-tenths of a percentage point to 89.2 percent. Distillate stocks, however, fell 1.3 million barrels to 125.7 million barrels.
The cash ($61.94/barrel) fell 0.5 percent Wednesday, the day the report came out, and 2.2 percent for the whole week. The crude has come under pressure since peaking last Tuesday at $66.60. This week, rally attempts were resisted at shorter-term moving averages, which are beginning to turn down. As well, WTI went after short-term resistance at $64.70s, but in vain. Thursday, the 200-day ($61.01) was tagged and held.
WTI has come a long way, having rallied 57 percent from late December through last week’s high, pricing in a lot of good news – both known and unknown. This for now gives bears an edge. The weekly in particular is grossly extended.
E-mini S&P 500: Currently net long 61.3k, up 58.9k.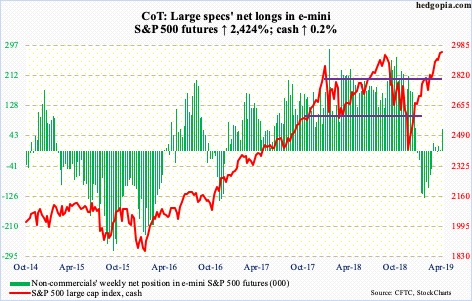
It seems the $55.3-billion reduction in money-market assets two weeks ago was tax-related. In the subsequent couple of weeks through Wednesday this week, these funds went up by $28.7 billion, including $21.7 billion this week (courtesy of ICI). This is not what bulls would like to see. The $3.1 trillion sitting in these funds needs to leave – a good chunk, bulls hope, into stocks. This is not happening, at least not yet.
Also in the week to Wednesday, US-based equity funds lost $1.8 billion. This followed outflows of $7.3 billion in the prior week (courtesy of Lipper). For a change, SPY (SPDR S&P 500 ETF), VOO (Vanguard S&P 500 ETF) and IVV (iShares core S&P 500 ETF) in the same week attracted a combined $1.5 billion (courtesy of ETF.com). That said, if not for the $4 billion SPY took in on Wednesday, these ETFs would have witnessed outflows. That was also the session the cash (2945.64) rallied to a new high of 2954.13 but only to close down 0.8 percent. The pretext was the Fed’s not-so-dovish message. But the fact remains that the S&P 500 rallied nearly 26 percent from December lows. Investors Intelligence bulls are at a 30-week high. It is normal for fatigue to set in, and for longs to begin to think about taking profit, at least some. Before Friday’s one-percent rally post-jobs report, they were doing that. The week edged up 0.2 percent, with a weekly hanging man.
Euro: Currently net short 105.5k, up 126.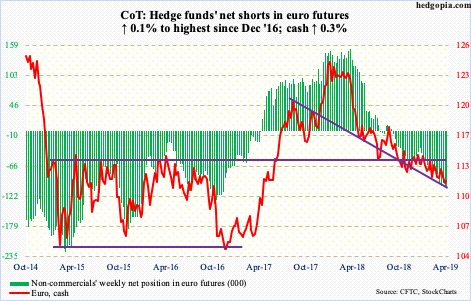
The rally since the intraday low of $111.12 six sessions ago stopped Wednesday at $112.65, just short of the 50-day. The average is still falling. The cash ($111.85) has made a series of lower highs since the euro peaked at $125.37 in January last year. Bulls have lost support at $113 and are currently trying not to decisively lose $112. Last week’s low has gained in importance.
Gold: Currently net long 66.2k, up 28.8k.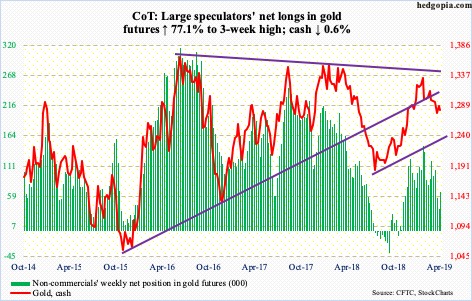
Since peaking at $1,349.80 on February 20, the cash ($1,281.30/ounce) has made lower highs. Five weeks ago, gold bugs lost $1,300, followed by support at $1,280s. Bulls and bears are currently fighting over control of this price point, a loss of which makes the metal subject to a test of the 200-day ($1,254.92). Gold has remained above the average for nearly five months now. Twice in the last couple of weeks, $1,260s drew bids.
Flows are not cooperating much. In the week to Wednesday, GLD (SPDR gold ETF) and IAU (iShares gold trust) respectively lost $48 million and $133 million (courtesy of ETF.com). This was the third straight week they both lost funds, with a combined loss of $572 million in the prior two.
Nasdaq 100 index (mini): Currently net short 2.4k, down 3.6k.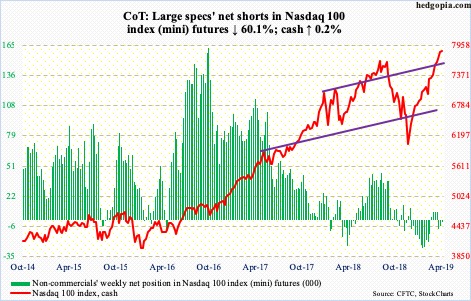
After pulling in $2.8 billion in the prior three weeks, QQQ (Invesco QQQ trust) in the week ended Wednesday was essentially flat, down $9 million (courtesy of ETF.com). The cash (7845.73) inched up 0.2 percent this week, with Friday’s 1.6-percent rally saving the week. This was the eighth straight up week. In the last 19, there has been only one down week.
Some cracks in this relentless upside momentum are appearing. Bulls will have lost the upper hand should 7700, which was also the prior high from last October, give way. This is also where a rising trend line from the lows of last December gets broken. This was tested this week – successfully – but a weekly hanging man showed up as well.
Russell 2000 mini-index: Currently net short 16.8k, down 2.1k.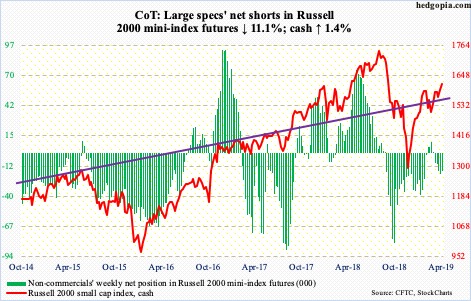
For the last nine sessions, the cash (1614.02) closed above both the 50- and 200-day. A mere 1.01 points separate the two. The Russell 2000 is the only major US equity index without a golden cross. Small-cap bulls would obviously cherish one, but for that they first need a genuine breakout at 1600.
Resistance just north of 1600 goes back to January last year. After the index bottomed last December, it rallied to 1602.10 on February 25 before pulling back. Monday, it once again retreated after tagging 1603.08. Friday’s two-percent jump puts the index slightly past or right at this resistance.
Daily Bollinger bands have tightened. A sharp move is imminent – either up or down. A breakout has the potential to take out stops and unleash risk-on sentiment – duration notwithstanding. At the same time, longs have been patiently waiting for exactly that outcome. Around 1575 rests a rising trend line from late December. A breakdown hence can tempt them into locking in profit. From December lows, the Russell 2000 is up north of 27 percent.
Flows have not quite been cooperating. In the week to Wednesday, $676 million came out of IWM (iShares Russell 2000 ETF), even as IJR (iShares core S&P small-cap ETF) took in $437 million (courtesy of ETF.com). In the prior two weeks, IWM lost $1.1 billion.
US Dollar Index: Currently net long 28.9k, up 194.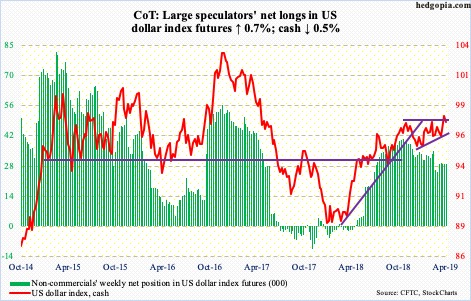
Resistance at 97.50s is proving tough to crack. This is the horizontal resistance of an ascending triangle the cash (97.26) currently finds itself in. Beginning last September when it made a low of 93.39, the US dollar index consistently made higher lows, even as rally attempts were getting denied at 97-97.50.
The US dollar index bottomed early last year around 88. Ascending triangles are often considered continuation patterns. For this to transpire, dollar bulls need to decisively punch through this resistance. Last Friday, it retreated from 98.09.
VIX: Currently net short 180.4k, up 2.6k.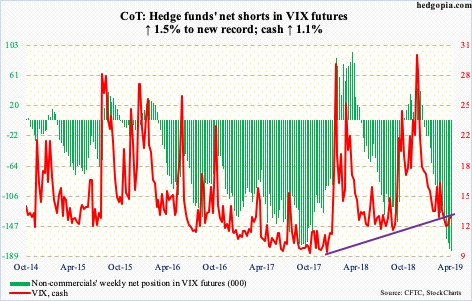
Volatility bulls may have a reason to be happy about. But for that they have to be looking at the weekly chart. On the daily, the pattern of lower highs continued this week, as the cash (12.87) was unable to hang on to Thursday’s intraday high of 15.92; near term, it can continue lower. The weekly, however, is beginning to look different. Several momentum indicators are beginning to turn up, even as the MACD is working on a potentially bullish crossover.
Concurrently, the 21-day moving average of the CBOE equity-only put-to-call ratio ended the week at 0.6006. Tuesday, the ratio dropped to 0.5962, not that far away from 0.5936 on March 1. It can always continue lower, as it did in January last year when it bottomed at 0.5430. But several times in the past, unwinding began from high-0.50s/low-0.60s.
Thanks for reading!
