
Following futures positions of non-commercials are as of April 28, 2020.
10-year note: Currently net short 49.4k, up 15.3k.
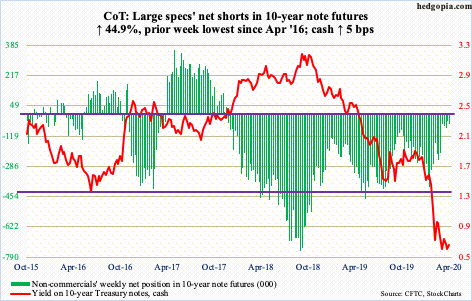
In the week ended February 11th, non-commercials held 398,919 net shorts in 10-year note futures. On the 12th that month, the 10-year yield tagged 1.64 percent before coming undone. Major US stock indices peaked a week later, and yields continued lower, touching 0.40 percent by March 9th – a record low. Apart from risk-averse investors choosing the safety of these sovereigns, as well as 30-year bonds, help also came from non-commercials who covered their short positions. By the end of Tuesday last week, they were net short 34,098 contracts – a four-year low. This further helped push down yields.
As this unfolded, the 10-year yield (0.64 percent) over the last eight weeks has charted out a descending triangle pattern. More often than not, this tends to be a continuation pattern. Yields have been in a downtrend for over three decades, and most recently since October 2018 when the 10-year yielded 3.25 percent. The lower trend line support lies at 0.58 percent, which was tested this week – successfully. Non-commercials added to their net shorts this week. Typically, a decisive breakdown will spur more directional trades, which in this instance means traders going long these notes, which translates to lower yields. If things evolve this way, the 0.4 percent low from March is the only reference point traders have at this point.
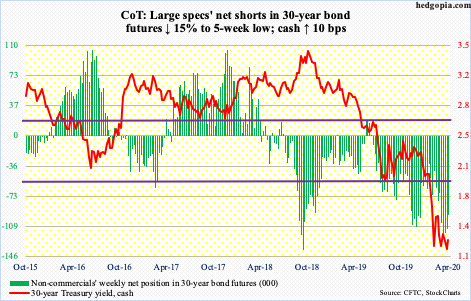
30-year bond: Currently net short 95.6k, down 16.9k.
Major economic releases next week are as follows.
Durable goods orders (March, revised) will be out Monday. Preliminarily, in the 12 months to March, orders for non-defense capital goods ex-aircraft – proxy for business capex plans – dropped 0.7 percent to a seasonally adjusted annual rate of $68.9 billion. This was a sixth year-over-year drop in nine months. Orders peaked at $70 billion in July 2018.
The ISM non-manufacturing index (April) is scheduled for Tuesday. Services activity in March declined 4.8 points month-over-month to 52.5 – a 43-month low.
Labor productivity (1Q20) is on tap Thursday. From 4Q18 to 4Q19, non-farm output/hour rose 1.8 percent.
Friday brings the employment report (April). In March, the economy lost 701,000 non-farm jobs – first m/m contraction since September 2010.
WTI crude oil: Currently net long 749.4k, down 7.5k.
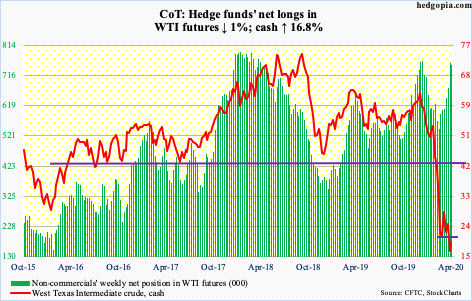
There was back-to-back weekly hammer. Tuesday, US crude for June delivery ($19.78/barrel) made an intraday low of $10.07, tagging the daily lower Bollinger band. This was followed by rallies in the next three sessions.
Friday also marked the official start of the 9.7-million barrels/day cut agreed between OPEC and non-OPEC countries including Russia – collectively knows as OPEC+. With this, WTI has rallied right into stiff resistance at $19-20. Should this give way, bulls will be eventually eyeing $27-28. The 50-day moving average lies at $28.18.
Fundamentally, as per the EIA, US crude stocks in the week to April 24 increased nine million barrels to 527.6 million barrels – a three-year high. Crude imports rose 365,000 b/d to 5.3 mb/d. As did distillate stocks, which grew 5.1 million barrels to 142 million barrels. Gasoline stocks, however, were down 3.7 million barrels to 259.6 million barrels. Refinery utilization rose two percentage points to 69.6 percent. Crude production fell 100,000 b/d to 12.1 mb/d. Production in the weeks and months ahead is likely headed much lower, as the rig count continues to fall. As of Friday, there were 408 in operation, down 582 from last year.
E-mini S&P 500: Currently net short 265.6k, up 73k.
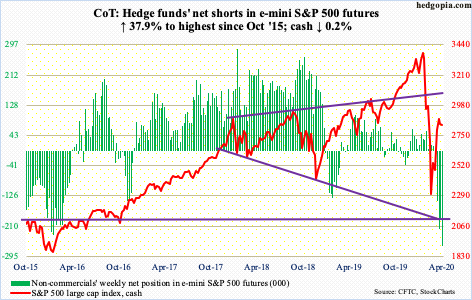
At Wednesday’s intraday high of 2954.86, the cash (2830.71) was up 4.2 percent, but ended the week down 0.2 percent. Quite a reversal in sentiment! Wednesday’s high also retraced 61.8 percent of the February 19th-March 23rd collapse. This was also just slightly under the 200-day at 3005.03. Plus, the 35-percent rally since the March low meant bulls were now having to go for low-quality – reflected, among others, in the way the ratio of SPYB (SPDR S&P 500 Buyback ETF) to SPY (SPDR S&P 500 ETF) was behaving (more on this here).
Friday, bulls were unable to defend 2850s-70s, which the S&P 500 broke out of early in the week. Odds favor the daily continues to unwind its overbought condition. Wednesday, 76.2 percent of S&P 500 stocks were above their 50-day; on March 12th, merely one percent were. Stocks have come a long way. Short squeeze helped, but flows are yet to fully cooperate.
In the week to Wednesday, $7 billion came out of US-based equity funds (courtesy of Lipper). In the same week, SPY (SPDR S&P 500 ETF), VOO (Vanguard S&P 500 ETF) and IVV (iShares Core S&P 500 ETF) collectively lost $7.2 billion (courtesy of ETF.com).
Nearest support lies at 2720s, followed by 2630s.
Euro: Currently net long 79.7k, down 7.5k.
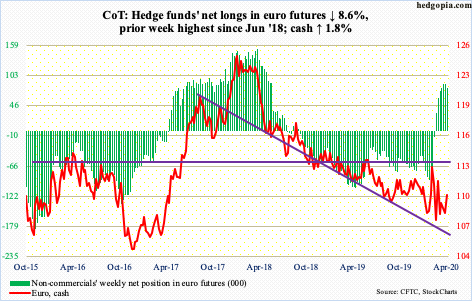
Eurostat estimated the eurozone economy tumbled 3.8 percent in 1Q20. At Thursday’s meeting, the ECB kept interest rates unchanged, and eased capital requirements for banks to provide market liquidity.
The cash ($110.11) had a strong session Thursday, up 0.7 percent to essentially close at the 50-day ($109.64), followed by a 0.5-percent rally on Friday. Thursday, the euro broke out of a six-week pennant. Prior to this, bulls defended $107.60s last week.
The 200-day at $110.42 is within striking distance. After this, the upper bound of a descending channel from September 2018 lies at $111.
Gold: Currently net long 262.7k, up 13.2k.
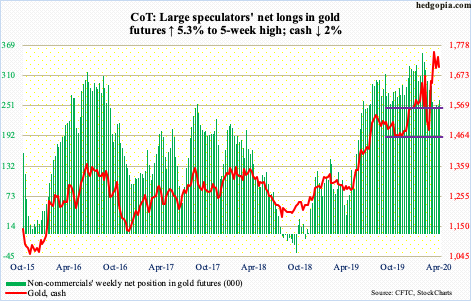
IAU (iShares Gold Trust) and GLD (SPDR Gold ETF) continue to attract funds. In the week to Wednesday, $355 million and $778 million went into these ETFs, in that order (courtesy of ETF.com). This brings the six-week haul to $9.2 billion.
The problem is, the cash ($1,700.90/ounce) has gone nowhere for over two months now and is clinging on to $1,700, which it broke out of three weeks ago. After that breakout, the metal rose to $1,788.80 by April 14th but was unable to build on that momentum.
If the weekly prevails, the metal can come under pressure. Minor support lies at $1,670s, which was successfully tested Friday. A breach opens the door toward the 50-day at $1,651.20 and $1,560s after that.
Nasdaq 100 index (mini): Currently net long 11k, up 2.3k.
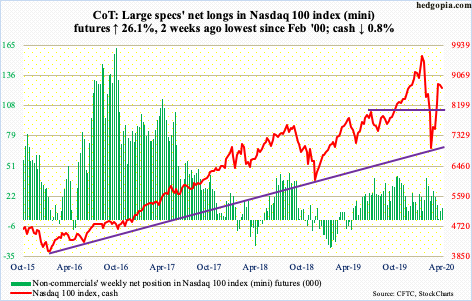
Wednesday, 92 percent of Nasdaq 100 stocks were above their 50-day; on March 16th, only two percent were. On February 19th when the rug was pulled out from under stocks, this metric stood at 83 percent. In other words, extreme investor fear evident at the March lows has given way to elevated optimism – again.
This week, post-earnings reaction to the top five – Microsoft (MSFT), Apple (AAPL), Amazon (AMZN), Alphabet (GOOG/L) and Facebook (FB) – was mixed. Friday, they all took a hit. They had run up so much ahead of the earnings a pullback only makes sense, especially considering the optimism that is currently priced in (more on this here). In the week to Wednesday, QQQ (Invesco QQQ Trust) gained $1.1 billion (courtesy of ETF.com).
Nearest support on the cash (8718.18) lies at 8350s. The 50- and 200-day are right underneath – respectively at 8228.17 and 8266.88. For whatever it is worth, a death cross formed this week.
Russell 2000 mini-index: Currently net short 35.5k, up 6.9k.
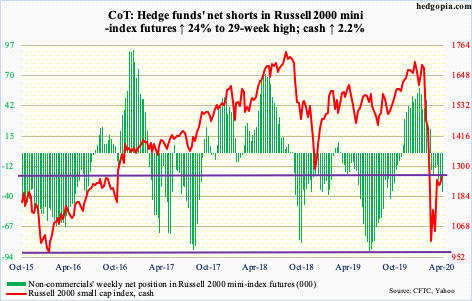
There were two strong moves this week – one Monday and the other Wednesday. Monday’s four-percent jump helped the cash (1260.48) bust through five-year horizontal resistance at 1250s, and Wednesday’s 4.8-percent surge retraced a little more than 50 percent of the February-March decline, which lies at 1333. At Wednesday’s high of 1373.39, the Russell 2000 was up 11.4 percent for the week, before giving back most of the gains in the next two sessions to end the week up 2.2 percent.
Equity bulls were probably hoping small-caps’ performance this week came at the beginning of the rally in March. More often than not, they tend to lead but were lagging this time – until this week. Four sessions after the breakout, 1250s was already tested Friday (more on this here). This likely cracks in the sessions ahead, opening the door to a test of 1170s.
US Dollar Index: Currently net long 16.1k, up 472.
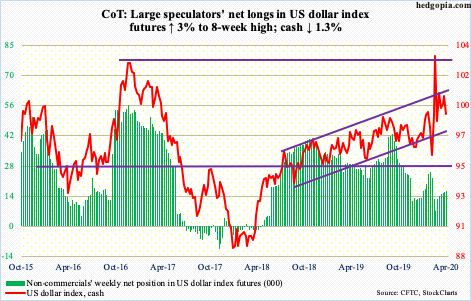
After getting denied at the upper bound of an ascending channel going back to August 2018 in three out of the prior four weeks, dollar bulls sort of gave up this week. Last week, the cash (99.10) was also rejected at five-year horizontal resistance at 100.50-101.
This Thursday, the US dollar index sliced through the 50-day (99.39), although short-term support at 98.80s held. The 200-day (98.18) is below. The lower bound of the aforementioned channel lies at 97.50s, which also represents straight-line support.
VIX: Currently net short 19k, down 13.3k.
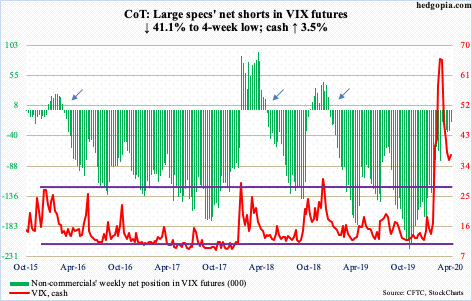
Volatility this week continued to compress early on, as the cash (37.19) posted an intraday low of 30.54 Tuesday. This was the lowest print since March 4th and came in a spinning top session. The candle showed up after VIX came under relentless pressure since peaking at 85.47 on March 18th.
The daily in particular is oversold. Nearest roadblock lies at 36-37. Friday’s intraday high of 39.57 just about tested the 20-day before getting rejected. The average, along with the 10-day, is trying to flatten out. A potential crossover ensures several weekly indicators including the RSI turn back up from the median. In this scenario, volatility gets bid up.
Thanks for reading!
