
Following futures positions of non-commercials are as of July 20, 2021.
10-year note: Currently net long 88.9k, up 32.9k.
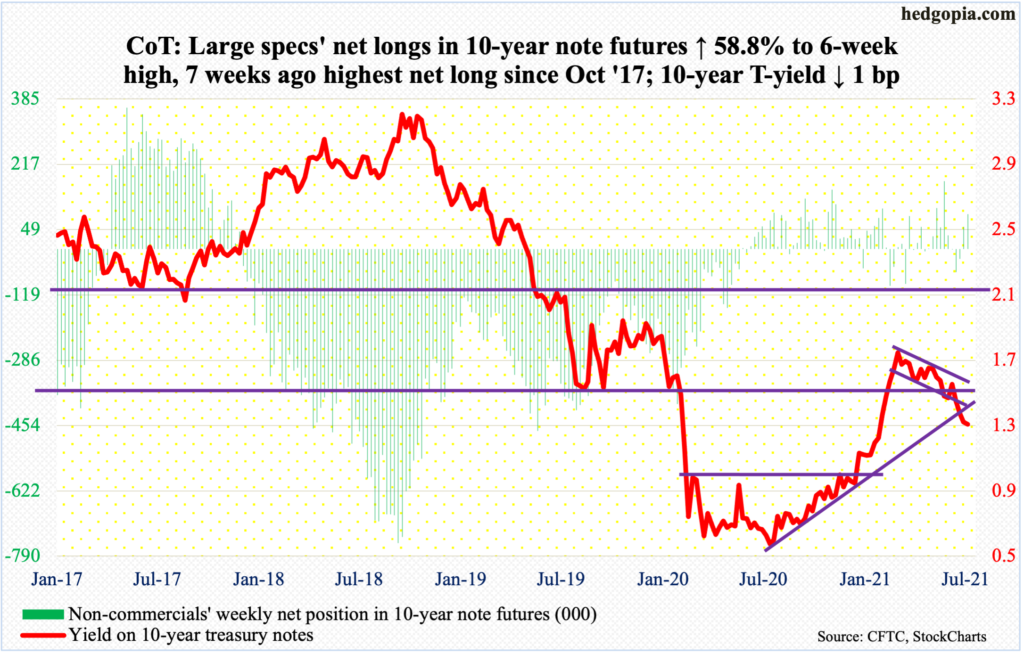
Next week, the FOMC meets. This is the year’s fifth policy meeting, and three more remain. A lot has happened since the last meeting on June 15-16. On the 16th last month, the 10-year yield closed at 1.57 percent. This Tuesday, rates touched 1.13 percent, with the week closing at 1.29 percent. All the while, the US economy continued to churn out strong numbers and inflation continued to perk up.
In the 12 months to June, headline and core CPI jumped 5.3 percent and 4.5 percent, which was the steepest price rise since July 2008 and November 1991 respectively (chart here); as recently as February, they were growing at a rate of 1.7 percent and 1.3 percent, in that order.
In the meantime, the Fed continues to stimulate the economy by expanding its balance sheet, buying up to $80 billion/month in treasury notes and bonds and $40 billion in mortgage-backed securities. As of Wednesday, it held $8.2 trillion in assets, up from $4.2 trillion in early March last year, when it began to aggressively print money.
To many, this is not making sense. It made sense in the early months of last year when the economy was grinding to a halt, but it no longer does to stick with the same emergency policy.
The chorus of voices wondering about the rationale behind this is getting louder, even within the FOMC, although the hawks are in the minority. In next week’s meeting, tapering will be a hot topic for sure. Odds favor the doves will begin to recognize the changing environment and give ground.
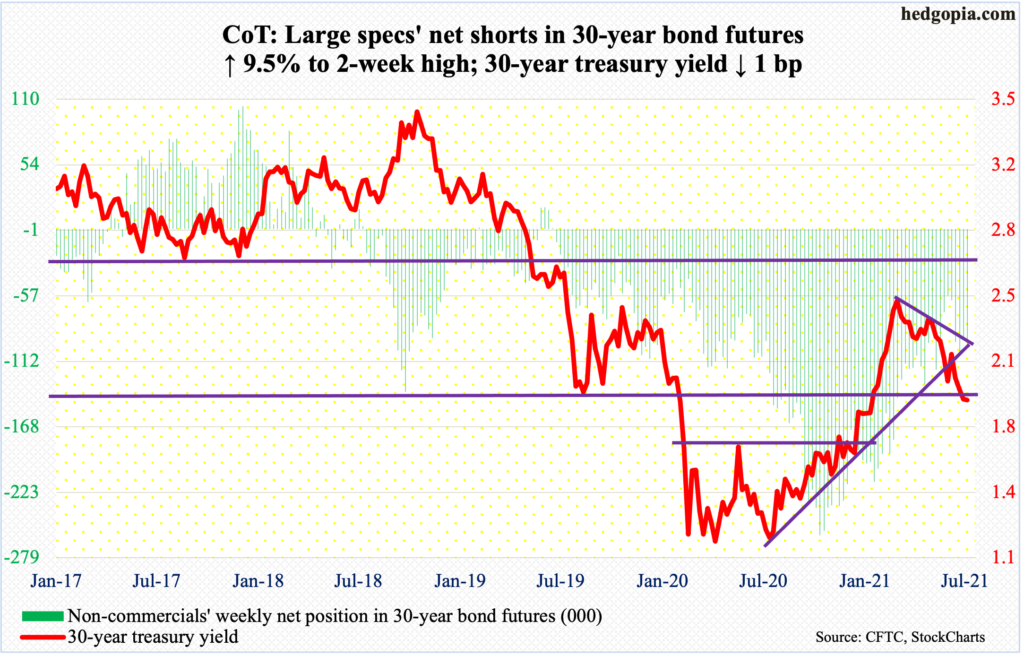
30-year bond: Currently net short 100.6k, up 8.7k.
Major economic releases for next week are as follows.
New home sales (June) are on deck for Monday. Sales in May were down 5.9 percent month-over-month to a seasonally adjusted annual rate of 769,000 units. In January, sales hit 993,000, up from a post-pandemic low of 582,000 in April last year.
Durable goods orders (June) and the S&P Case-Shiller Home Price Index (May) will be published on Tuesday.
Orders for non-defense capital goods ex-aircraft – proxy for business capex plans – jumped 23 percent year-over-year to $75.4 billion, which is a new record. In April last year, orders languished at $59.9 billion.
Nationally in April, US home prices surged 14.6 percent y/y – the steepest rise since October 1979.
Thursday brings GDP (2Q21, first estimate). Real GDP grew 6.4 percent in 1Q21, coming on the heels of growth of 4.3 percent in 4Q20 and 33.4 percent in 3Q20. The Atlanta Fed’s GDPNow model currently forecasts growth of 7.6 percent in 2Q21.
Personal income/spending (June), the employment cost index (2Q21) and the University of Michigan’s consumer sentiment index (July, final) come out on Friday.
Core PCE, which is the Fed’s favorite measure of consumer inflation, increased 3.4 percent in the 12 months to May. This was the steepest price rise in 29 years.
In 1Q21, private-industry total comp grew 2.8 percent y/y – a four-quarter high. During the quarter, wages & salaries increased three percent and benefits 2.5 percent.
July’s preliminary count showed consumer sentiment fell 4.7 points m/m to 80.8 – a five-month low.
WTI crude oil: Currently net long 450.4k, down 62.7k.
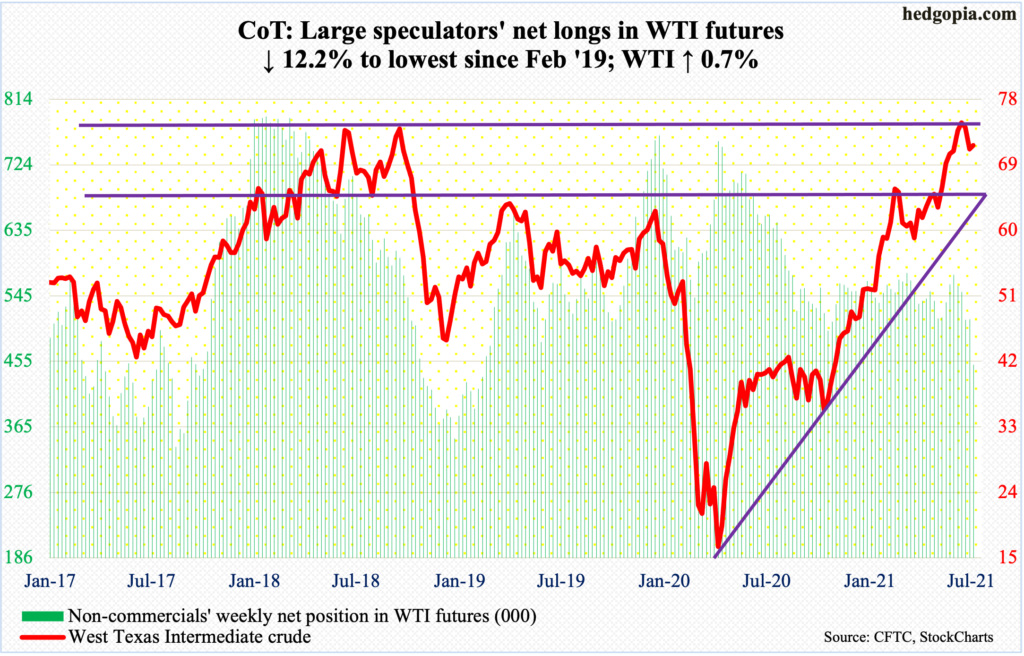
After last week’s four-percent drop, this week started with Monday’s 7.2-percent tumble, past the 50-day moving average. On Tuesday, WTI ($72.07/barrel) went on to breach $66-$67 support intraday but only to bottom at $65 and end the session up. On Wed, the 50-day was reclaimed.
For the week, the crude rose 0.7 percent but formed a candle with a huge lower shadow. Time will tell if this is a hanging man or a bullish hammer. Odds favor it is the former. Before this, as mentioned earlier, WTI dropped four percent last week, and before that there were two back-to-back weekly spinning tops.
Longs are sitting on tons of gains. WTI bottomed at $6.50 in April last year and tagged $76.98 on the 6th this month. This has the potential to be an important top. Both the weekly and monthly have a ways to go before the overbought conditions they are in are unwound.
E-mini S&P 500: Currently net long 34.2k, down 41.3k.
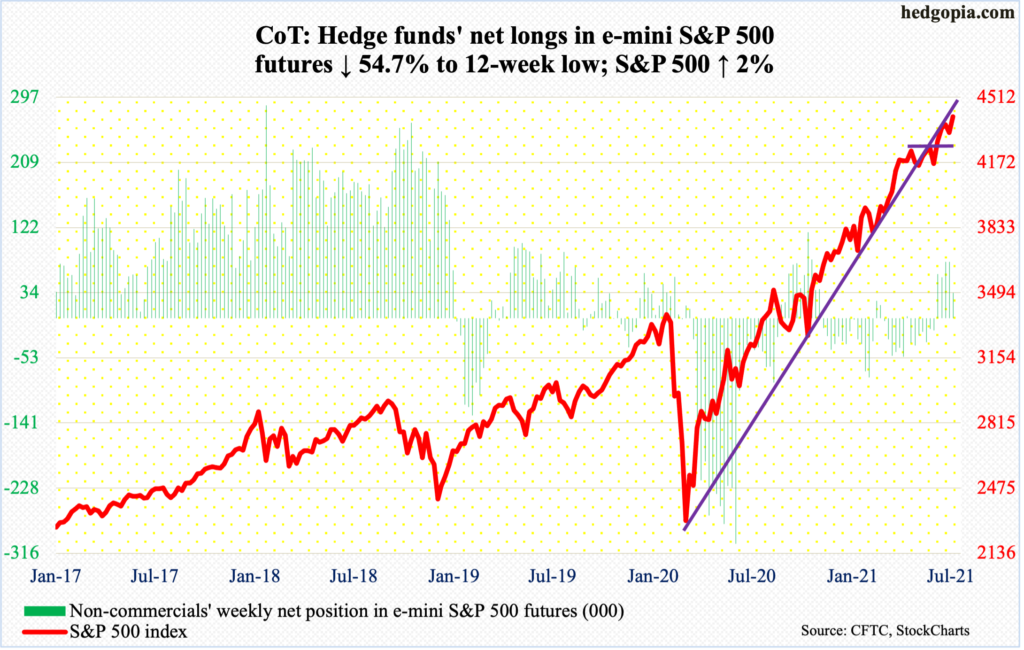
Selling picked up where it left off last week. On Monday, the S&P 500 gapped lower to end the session down 1.6 percent; bulls’ consolation was that the large cap index was down as much as 2.2 percent before they managed to defend the 50-day (more on this here). Since May last year, this was the ninth time a drop to the average was used as an opportunity to go long. Whether or not the trade will work this time will pretty much be decided next week when the top six US companies – all tech – will report their June quarter. They account for a disproportionate share of market cap-weighted indices such as the S&P 500 and Nasdaq 100.
Going into next week, the S&P 500 rallied to a new high, with a weekly bullish engulfing candle.
Bulls should be happy with this week’s price action, but they are probably not happy with how flows fared. In the week to Wednesday, SPY (SPDR S&P 500 ETF), VOO (Vanguard S&P 500 ETF) and IVV (iShares Core S&P 500 ETF) lost $149 million (courtesy of ETF.com). In the same week, US-based equity funds lost $8.8 billion (courtesy of Lipper).
Euro: Currently net long 45.8k, down 13.9k.
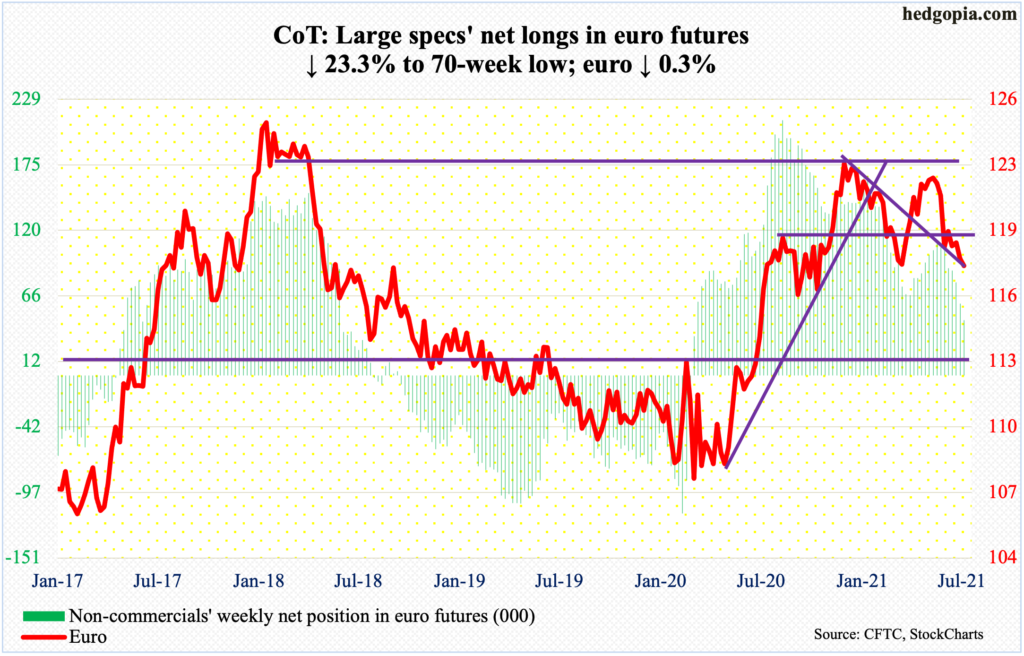
The euro ($1.1772) made yet another low on Tuesday tagging $1.1755. This was a fourth straight weekly low. Nonetheless, the March 30 low of $1.1712 is intact. So long as this remains the case, euro bulls can have hope. The daily can rally in the right circumstances. Nearest resistance lies at $1.1840s.
Longer term, monthly overbought indicators are still unwinding, with the MACD on the verge of a potentially bearish cross-under.
Gold: Currently net long 196k, up 5.1k.
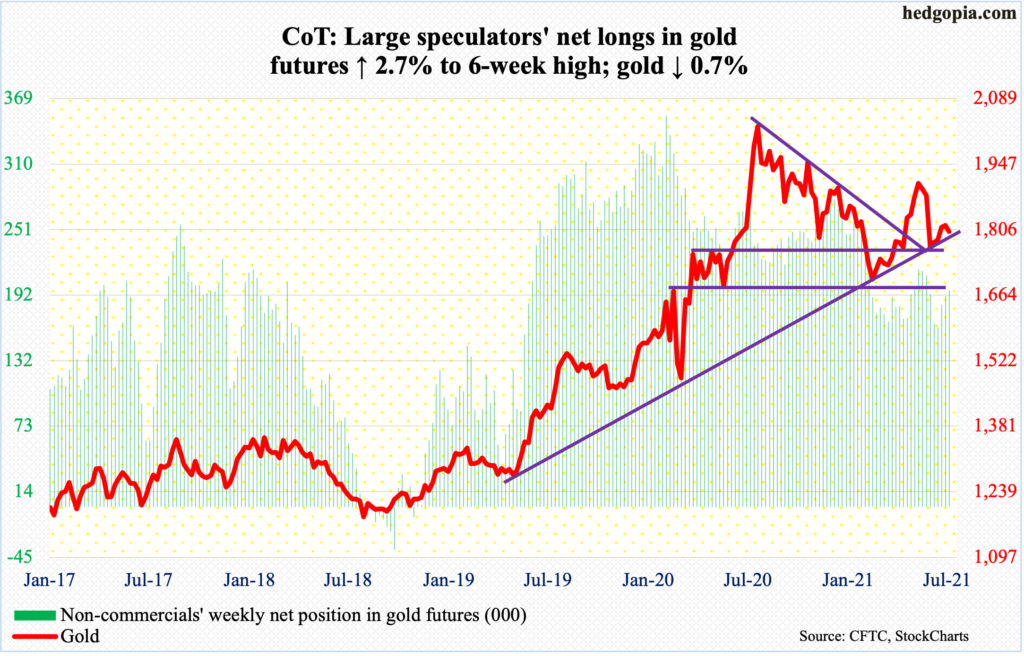
After having been rejected at the 200-day on Wednesday through Friday last week, gold bugs once again went after the average on Tuesday (this week) but only to meet with disappointment.
Last week, gold ($1,801.80/ounce) rose as high as $1,835. This week, support at $1,800 was tested a few times. A breach opens the door toward $1,760s-$1,770s, which was used as an opportunity to go long in the second half last month.
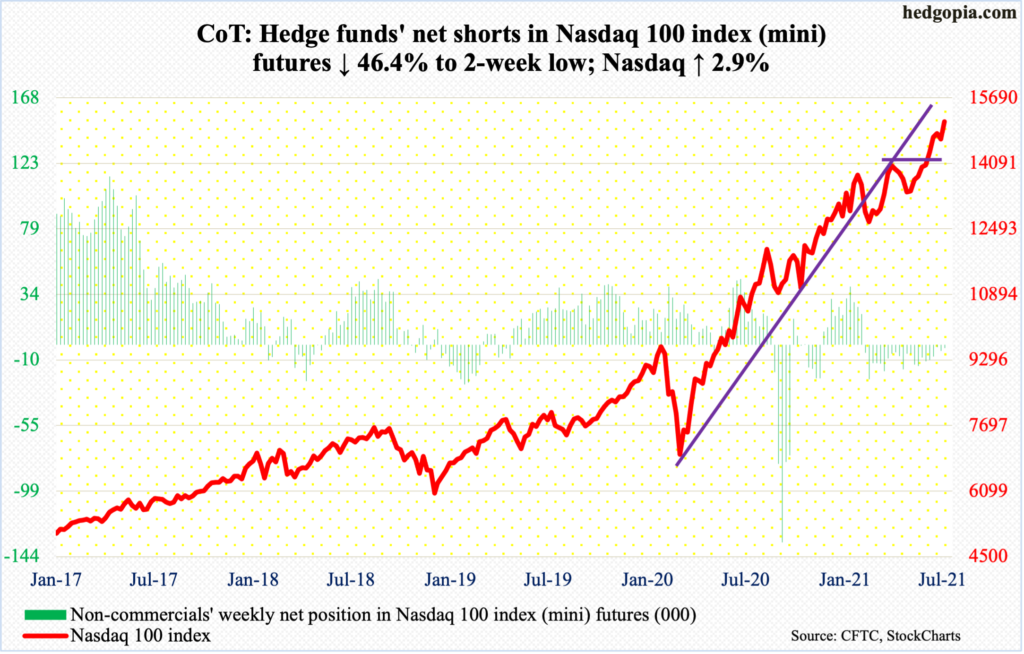
Nasdaq 100 index (mini): Currently net short 2.3k, down 2k.
Next week is big in tech. The top six will make their June-quarter results public. Tesla (TSLA) reports on Monday, Apple (AAPL), Microsoft (MSFT) and Google owner Alphabet (GOOG) on Tuesday, Facebook (FB) on Wednesday, and Amazon (AMZN) on Thursday.
These are massive companies. TSLA – the smallest of the six measured by market cap – enjoys north of $600 billion valuation, with AAPL and MSFT north of $2 trillion, AMZN and GOOG just under $2 trillion and FB just over $1 trillion. They exert a lopsided influence on market cap-weighted indices, accounting for over 45 percent of the Nasdaq 100/QQQ and nearly 24 percent of the S&P 500/SPY.
Ahead of the results, MSFT, GOOG and FB this week rallied to new highs, AAPL and AMZN are within striking distance of setting new highs, while TSLA is the weakest of the lot trading near its 50- and 200-day.
In the latest selloff, the Nasdaq 100 declined 3.6 percent, having peaked at 15002 on the 13th. On Friday, the index (15112) rallied to a fresh high. Expectations have built up for next week’s results.
Russell 2000 mini-index: Currently net short 56k, up 12.9k.
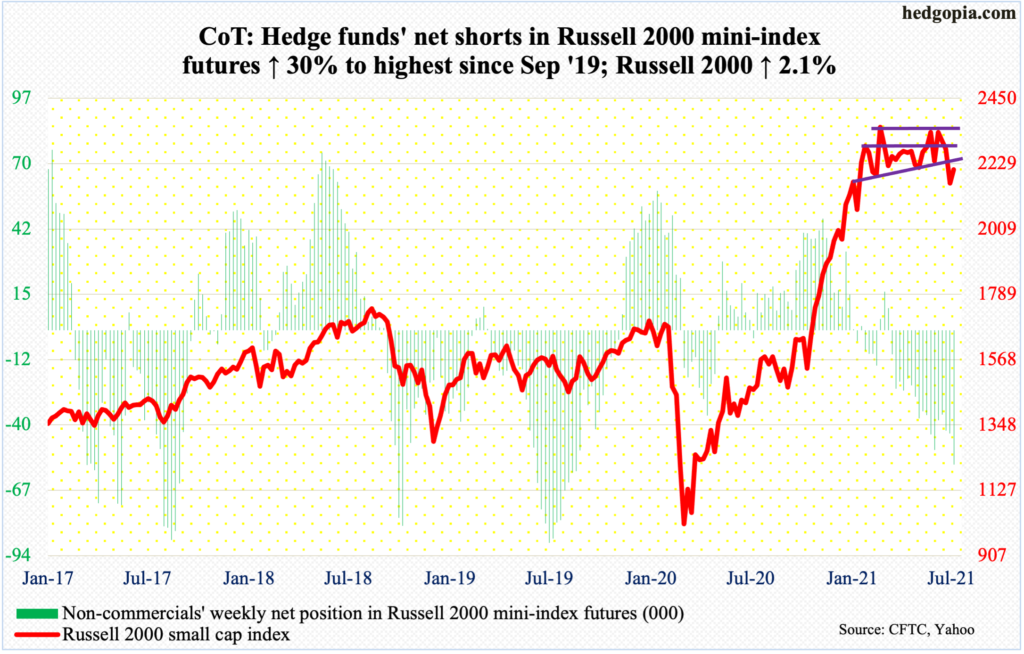
The lower bound of a five-month range was just about tested on Monday as the Russell 2000 (2210) made an intraday low of 2107. The small cap index has been stuck between 2350s and 2080s. The sideways action preceded a massive rally from the lows of March last year. Bulls hope this eventually resolves to the upside. By defending the support this week, they have increased their chances of launching another attack at the resistance. Before that happens, they need to take out 2280s.
In the meantime, non-commercials’ net shorts have risen to the highest since September 2019. This is a potential opportunity for longs if they succeed in forcing a squeeze. It is a big if.
US Dollar Index: Currently net long 12.2k, up 931.
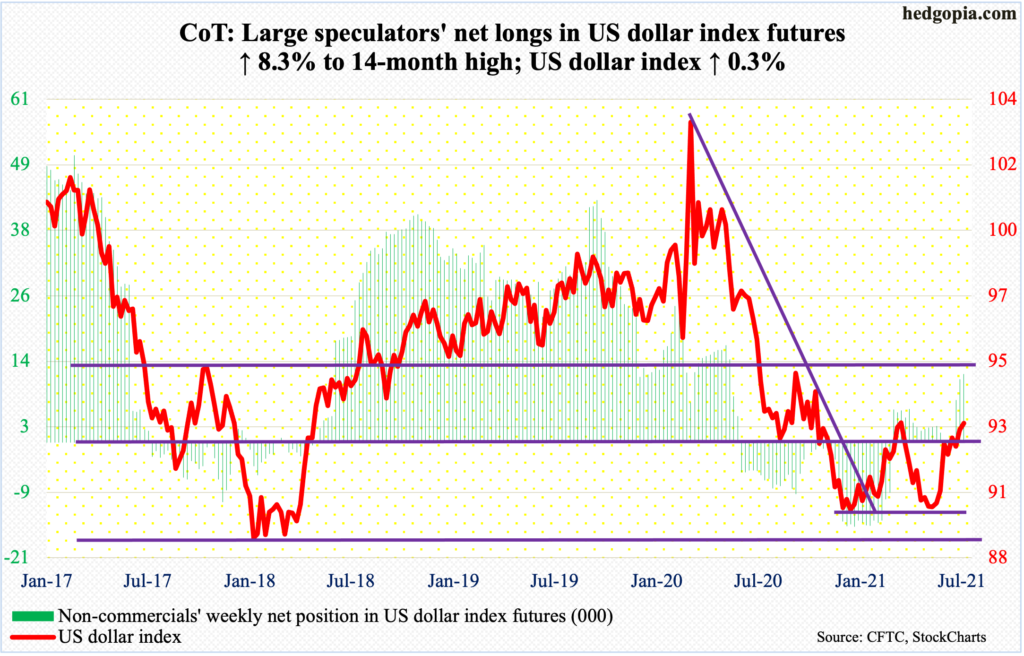
The US dollar index on Wednesday came within 0.28 of surpassing the March 31 high of 93.47. This was made possible after short-term resistance at 92.80s was taken out as soon as the week got underway. But Wednesday’s rally was short-lived; in fact, the session ended in the red, leaving behind, as was the case on Tuesday, a long upper shadow.
The index (92.93) has had a decent eight-week run, having bottomed on May 25 at 89.52.
The daily remains overbought and is likely in a process of unwinding.
VIX: Currently net short 50.7k, down 10.6k.
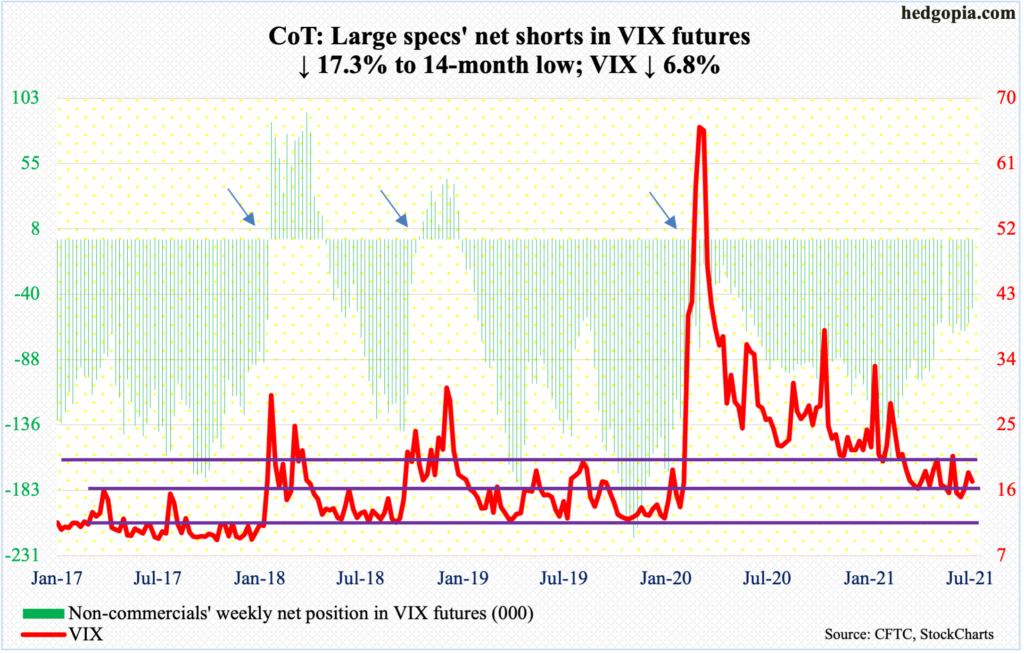
No sooner than VIX gapped up on Monday than it was filled on Wednesday. The volatility index started the week with Monday’s gap-up in which it rallied as high as 25.09 although it closed at 22.50. This established a higher high taking out 21.82 from June 21.
At the same time, Monday’s rally turned out to be a spike reversal. By Friday, VIX (17.20) dropped below 17 intraday and on the daily has room to still move lower in the right circumstances for volatility bears.
Despite all this, the monthly continues to act constructively for volatility bulls (more on this here).
Thanks for reading!
