
Following futures positions of non-commercials are as of Oct 10, 2017.
10-year note: Currently net long 192.6k, down 39.6k.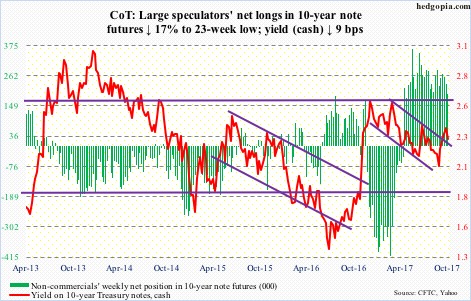
Market participants constantly rerate expectations. They have to. The related variables are dynamic and constantly changing themselves.
The nimble ones are quick on the trigger. The slow ones sometimes can have their head handed to them.
Just the nature of things.
Back in 2000, U.S. stocks posted a major peak in March. Hindsight is always 20/20, but those who bought in late ’99 or early ’00 probably did not think they would essentially become the proverbial greater fools. Ditto with another major peak in U.S. stocks in October 2007.
Or, take the low in 10-year Treasury yields in July last year. Yields bottomed at 1.34 percent back then – successfully testing the lows of four years earlier. Many thought – yours truly included – rates were still headed lower. Those who failed to react quickly to changing sentiment got hurt. TLT (iShares 20+ year Treasury bond ETF) has shed nearly 10 percent since.
In this context, what is going on in the fed funds futures market is apropos here.
Just a month ago, traders gave scant odds for a 25-basis-point hike in the December meeting. Now, it is almost a lock, although the odds dropped from 92 percent last week to 82 percent this week. The FOMC minutes for the September 19-20 meeting released this week pretty much confirmed that a hike was imminent. Traders adjusted quickly, as FOMC members began jawboning strongly.
The lesson in all this is that it is never a good idea staying wedded to a position, particularly if – as is the case with U.S. stocks currently – investor sentiment is effusive, valuations are elevated and have had a great run.
30-year bond: Currently net long 27.6k, up 12.8k.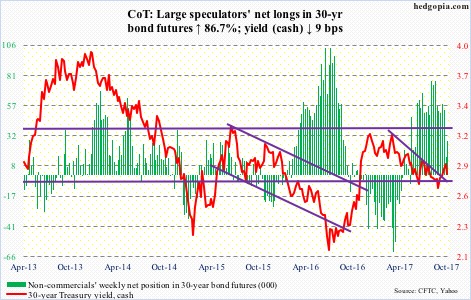
Major economic releases next week are as follows.
Tuesday brings industrial production (September), the NAHB housing market index (October), and the Treasury International Capital (August).
U.S. capacity utilization rose 0.4 percent month-over-month in August to 76.1 percent. This was the sixth straight up month following 24 down months out of 25. Utilization peaked at 79.2 percent in November 2014.
Home builder sentiment in September dropped three points m/m to 64. March’s 71 was the highest since June 2005.
In the first seven months this year, foreigners net-purchased $45.5 billion in U.S. equities. On a 12-month rolling total basis, January-July purchases totaled $58.7 billion – down from $94.3 billion in June, but the trend is up. In February last year, they net-sold a record $142 billion.
September’s housing starts are due out Wednesday. August fell 0.8 percent m/m to a seasonally adjusted annual rate of 1.18 million units. The cycle high of 1.33 million – the highest since August 2007 – was reached last October.
Existing home sales for September are published Friday. Sales in August fell 1.7 percent m/m to 5.35 million units (SAAR). March’s 5.7 million units were the highest since February 2007.
Crude oil: Currently net long 435.6k, down 15.4k.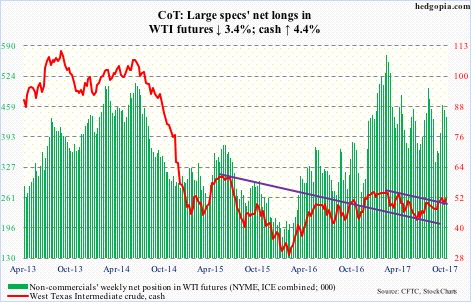
After losing the 200-day moving average but finding support at the 50-day ($49.23/barrel) last Friday, spot West Texas Intermediate crude ($51.45) started the week by reclaiming the former.
Near term, there is room for continued rally toward $52-$53.
That said, if weekly overbought conditions prevail, it is likely the 50- and 200-day get tested again. Merely $0.32 separate the two. Right around there lies a rising trend line from June this year – a must-hold for the bulls.
For the week ended October 6, the EIA report showed US crude stocks continued to drop, down 2.7 million barrels to a six-week low of 462.2 million barrels.
Distillate stocks dropped as well – down 1.5 million barrels to 134 million barrels. This is the lowest since June 2015.
Gasoline stocks, on the other hand, rose 2.5 million barrels to 221.4 million barrels – a five-week high.
Crude production decreased 81,000 barrels/day to 9.48 million b/d. The prior week was a 26-month high.
Crude imports, however, rose 403,000 b/d to 7.62 mb/d – a six-week high.
Refinery utilization rose 1.1 points to 89.2 percent. Pre-Harvey, utilization peaked at 96.6 percent and bottomed at 77.7 percent in the aftermath of the hurricane.
E-mini S&P 500: Currently net long 140.5k, up 39k.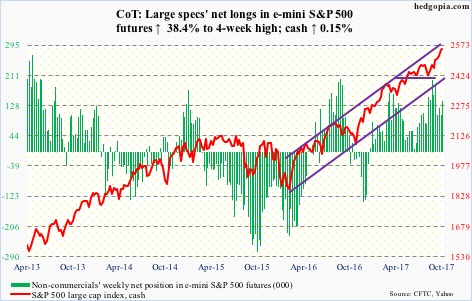
U.S.-based equity funds in the week to Wednesday pulled in $2.9 billion (courtesy of Lipper).
In the same week, a total of $319 million moved into three S&P 500-focused ETF’s, with SPY (SPDR S&P 500 ETF) losing $892 million, and VOO (Vanguard S&P 500 ETF) and IVV (iShares core S&P 500 ETF) attracting $71 million and $1.1 billion, respectively (courtesy of ETF.com).
In a doji week, the cash managed a 0.15-percent rise, with some signs of fatigue beginning to show up. Yet, as overbought as it is, the index has not tested the 10-day in the last 11 sessions.
Besides the 10- and 20-day, the first layer of support lies at 2509, which it broke out of two weeks ago.
In the meantime, the ratio of Investors Intelligence bulls to bears this week posted four – a rare reading. This was the 16th such occurrence going back four years. If past is prologue, this can mark at least a short-term peak in stocks.
Euro: Currently net long 98.1k, up 7.2k.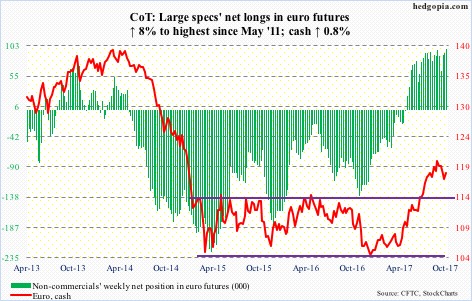
On Tuesday, Catalan did not immediately push ahead with independence from Spain. This set in motion a relief rally in the cash ($118.21).
But the issue is far from resolved. Mariano Rajoy, Spanish prime minister, has given the Catalan government until Monday to clarify whether or not it has declared independence. He has the option of invoking article 155 to suspend Catalan’s autonomy.
During all this, the euro, after finding support at the daily lower Bollinger band last Friday, rallied this week, but only to face resistance at the 50-day ($118.44), which also represents short-term horizontal resistance.
Gold: Currently net long 200.1k, down 3.7k.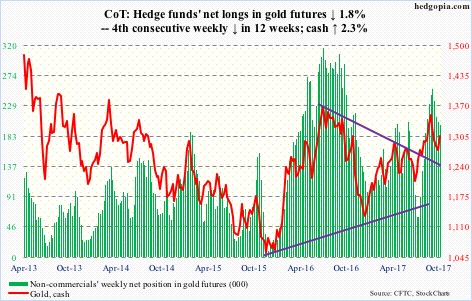
Going back seven years, $1,300/ounce on the cash has been a level where the bulls and bears have consistently fought a tug of war. Most recently, the metal ($1,304.60) broke out late August, fell back under it a month later, only to recapture it this week. The 50-day lies at $1,300.71.
There is room to rally on the daily chart.
Flows probably need to improve.
In the week through Wednesday, IAU (iShares gold trust) lost $37 million, while GLD (SPDR gold ETF) was essentially flat (courtesy of ETF.com).
Nasdaq 100 index (mini): Currently net long 30.1k, up 872.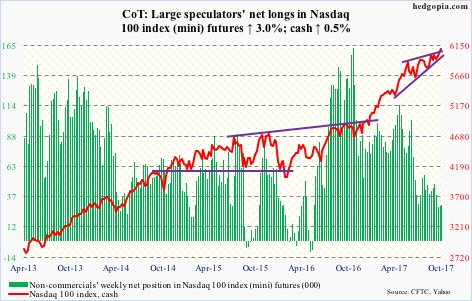
On Thursday last week, the cash (6092.45) broke out of nearly two-and-a-half-month resistance at 6000. This likely prompted flows into QQQ (PowerShares QQQ trust), which during the week ended Wednesday this week took in $473 million, reversing outflows of $1.4 billion in the prior two (courtesy of ETF.com).
The index arguably has poked its head out of a rising four-month wedge. A convincing breakout can potentially cause short squeeze, as short interest on XLK (SPDR technology ETF) in particular remains elevated.
Russell 2000 mini-index: Currently net long 12.9k, up 17.4k.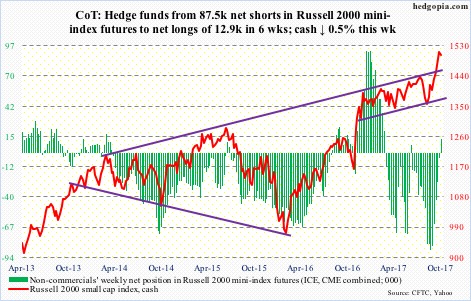
The cash (1502.66) is sending out signs of fatigue, with sideways-to-slightly-down action in the past nine sessions. The bulls hope this ends up acting as a flag, but may not turn out that way. At least near term, the path of least resistance is probably down.
The risk facing the bulls is this. The Russell 2000 rallied 12-percent-plus since reaching an intraday low on August 18. Non-commercials lent a big helping hand.
As the index proceeds to unwind overbought conditions, the bulls can get tempted to lock in gains.
In the week to Wednesday, IWM (iShares Russell 2000 ETF) and IJR (iShares core S&P small-cap ETF) combined lost $110 million – the first outflows from these ETF’s in the past four weeks (courtesy of ETF.com).
US Dollar Index: Currently net short 3.7k, up 402.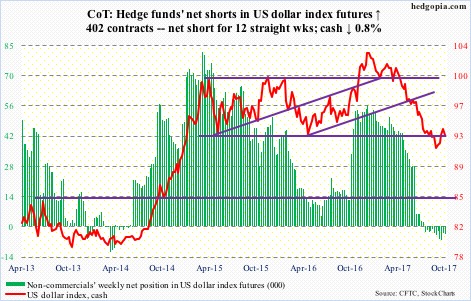
Near-term resistance at 94 held on the cash (92.93). As did broken-resistance-turned-support at 92.50-60.
Daily indicators have reached the median. If there has been a real change in sentiment toward the greenback, the bulls should be able to defend this support. The 50-day lies at 92.77.
Except, non-commercials continue to remain in wait-and-see mode.
VIX: Currently net short 174.7k, up 4k.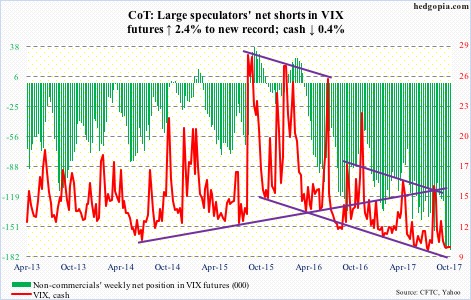
Daily Bollinger bands on the cash continue to narrow, with the upper bound having provided resistance several times in the week. In the meantime, the 10- and 20-day are converging, even as the 50- and 200-day are flattish.
This is an opportunity for volatility bulls. Remains to be seen if they can cash in. Non-commercials are net short VIX futures up to their eyeballs – record this week – and, if squeezed, can provide a huge tailwind to the cash.
Thanks for reading!
