
Following futures positions of non-commercials are as of Oct 17, 2017.
10-year note: Currently net long 106.3k, down 86.3k.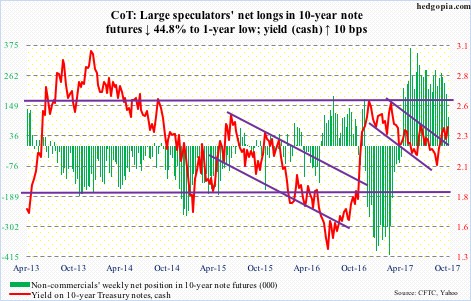
If Politico is to be believed, President Trump is leaning toward Jerome Powell, Fed governor, for the next Federal Reserve chair. He is one of the few on the president’s short list. Janet Yellen’s (current chair) term expires next February.
Nominated by President Obama, Mr. Powell is a Republican, and is considered a dove – along the lines of Ms. Yellen – and likely does not get opposed by the Democrats.
Should he get the nod, markets’ reaction will be telling.
In the wake of the financial crisis, the Fed eased aggressively, by both lowering the fed funds rate and through three iterations of quantitative easing. Markets have gotten used to monetary morphine – so to speak.
The Ms. Yellen-led Fed has been ultra accommodative. The balance sheet has ballooned to $4.6 trillion, which it now plans to unwind beginning this month. Since December 2015, the fed funds rate has gone up by merely 100 basis points to 1.16 percent – still below annual inflation.
In all likelihood, Mr. Powell would not want to rock the boat, hence will maintain the status quo. Markets should be able to rally on this. Unable to do so can be interpreted as fatigue setting in – or the drugs in question losing their efficacy.
30-year bond: Currently net long 51k, up 23.4k.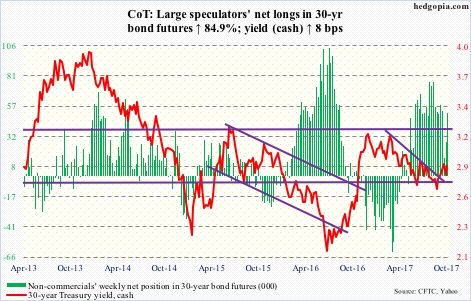
Major economic releases next week are as follows.
Wednesday brings durable goods orders (September) and new home sales (September).
August orders for non-defense capital goods ex-aircraft – proxy for business capital expenditures – rose four percent year-over-year to a seasonally adjusted annual rate of $65 billion. Orders peaked at $70.3 billion in September 2014.
New home sales in August dropped 3.4 percent month-over-month to 560,000 units (SAAR). Sales peaked at 638,000 in March this year – the highest since November 2007.
Pending home sales for September are published Thursday. August was down 2.8 points m/m to 106.3. The cycle high – as well as a decade high – 113.6 was reached in April last year.
GDP (3Q17, advance) and the University of Michigan’s consumer sentiment (October, final) are due out Friday.
Real GDP grew 3.1 percent in 2Q17. This was the highest growth rate since 3.2 percent in 1Q15. The economy grew at an average of 2.2 percent post-Great Recession, much slower than the long-term average of 3.2 percent going back to 2Q47.
Preliminarily, consumer sentiment jumped six points m/m in October to 101.1. This was the highest since 103.8 in January 2004 and also the first time it crossed 100 since then.
Crude oil: Currently net long 445k, up 9.4k.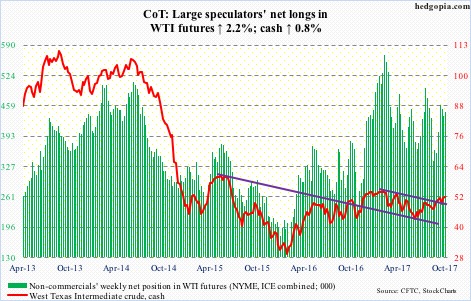
Sellers once again showed up on spot West Texas Intermediate crude ($51.84/barrel) at $52-$53 resistance, which was also tested three weeks ago. In the event of downward pressure near term, support at $50-ish is crucial.
The 50- and 200-day moving averages – $49.48 and $49.51, respectively – are converging around that support. This is also where a rising trend line from June this year gets tested – a must-save for the bulls.
The EIA report for the week of October 13 – out Wednesday – was a mixed bag.
Crude stocks continued to decline, down 5.7 million barrels to 456.5 million barrels. This was the lowest since January last year.
Crude imports dropped too, by 134,000 barrels/day to 7.48 million b/d.
Notably, crude production fell 1.1 mb/d to 8.41 mb/d – the lowest since May 2014.
Gasoline and distillate stocks, however, rose – up 908,000 barrels and 528,000 barrels to 222.3 million barrels and 134.5 million barrels, respectively.
Refinery utilization fell 4.7 percentage points to 84.5 percent – a four-week low. Pre-Harvey, utilization peaked at 96.6 percent and bottomed at 77.7 percent in the aftermath of the hurricane.
E-mini S&P 500: Currently net long 161.9k, up 21.4k.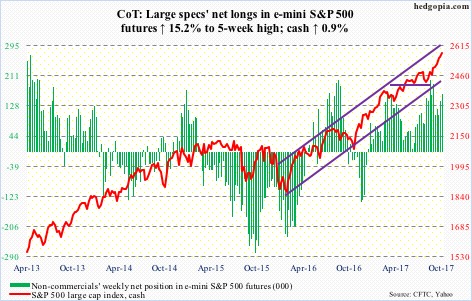
Buy-the-dip is alive and well.
Thursday saw the cash come under pressure – was down 0.5 percent initially – but dip-buyers showed up in the very first half hour. The session ended flat, with a test of the 10-day intraday. This was followed by a 0.5-percent rally Friday, to a fresh high.
The Thursday action was preceded by healthy inflows. In the week ended Wednesday, $5.4 billion moved into U.S.-based equity funds, following inflows of $2.9 billion in the prior week (courtesy of Lipper).
In the same week, a total of $6.1 billion moved into three S&P 500-focused ETF’s, with SPY (SPDR S&P 500 ETF) taking in $5.2 billion, VOO (Vanguard S&P 500 ETF) $470 million and IVV (iShares core S&P 500 ETF) $475 million (courtesy of ETF.com).
Sentiment continues to remain effusive. For the second week running, Investors Intelligence bulls were 60 percent or higher. As complacent as it looks, they deserve kudos for being on the right side of trade – more so if they are nimble enough to exit when momentum reverses.
Euro: Currently net long 90.5k, down 7.6k.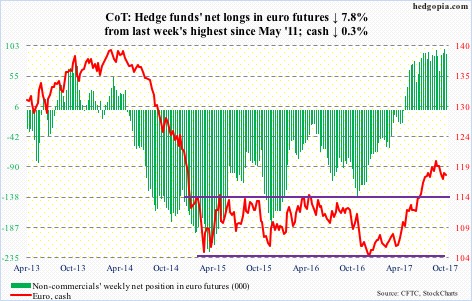
Madrid said Thursday it plans to invoke Article 55 of the Spanish constitution on Saturday. On Wednesday – Catalan leader Carles Puigdemont had said he would press ahead with a formal declaration of independence if Mariano Rajoy, Spain’s prime minister, suspends Catalonia’s political autonomy.
Next week is setting up to be interesting.
This week, the cash ($117.85) once again went after the 50-day ($118.47) – unsuccessfully. The average also approximates short-term horizontal resistance.
Gold: Currently net long 200.7k, up 612.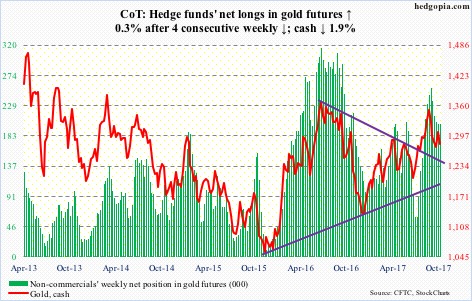
In the eight sessions through Wednesday, GLD (SPDR gold ETF) saw no activity whatsoever in terms of flows, while IAU (iShares gold trust) saw one inflows of $7.5 million (courtesy of ETF.com).
Last week, the cash ($1,280.50/ounce) closed just north of seven-year resistance at $1,300. This week, gold bugs tried to build on that, but were unsuccessful. Monday’s intraday high of $1,308.4 was also an unsuccessful test of the 50-day.
Unless this resistance is taken out, in a worse-case scenario near term, the metal drops to test a rising trend line from last December around $1,250. The 200-day ($1,257.45) is right there.
Nasdaq 100 index (mini): Currently net long 28.9k, down 1.1k.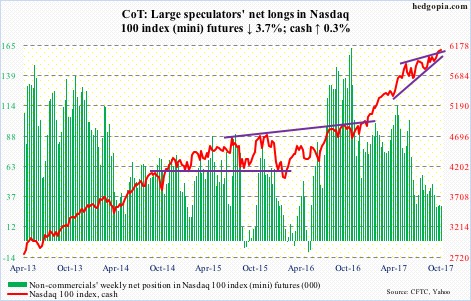
The cash (6108.82) continues to remain north of 6000, which it broke out of 12 sessions ago, but building on it has proven difficult. The week produced a doji.
In the week through Wednesday, QQQ (PowerShares QQQ trust) lost $236 million. This followed inflows of $473 million in the prior week (courtesy of ETF.com).
In a down session Wednesday, the index rose to an all-time high of 6129.49, followed by a 0.4-percent drop Thursday and a 0.3-percent rise Friday. The bulls would have lost this tug of war with the bears should they lose 6000.
Russell 2000 mini-index: Currently net long 23.7k, up 10.8k.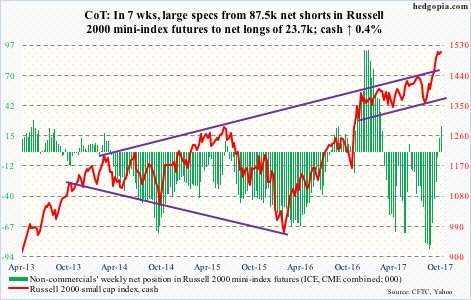
Since rising to a new all-time high of 1514.94 on October 5, the cash (1509.25) traded within a descending channel – until Friday, when it rallied 0.5 percent to break out of it. The bulls hope this is a flag breakout.
In this respect, the onus is on to them, as short-squeeze fuel is lacking.
Non-commercials went from net shorts of 87,499 contracts in Russell 2000 mini-index futures seven weeks ago to net longs of 23,719. Similarly, as of the end of November last year, short interest on IWM (iShares Russell 2000 ETF) stood at 119.1 million, which then dropped to 93.7 million by mid-January. They each played a major role in the post-election rally in the cash.
In the meantime, in the week to Wednesday, $38 million came out of IWM, even as IJR (iShares core S&P small-cap ETF) attracted $79 million (courtesy of ETF.com).
US Dollar Index: Currently net short 4.7k, up 1k.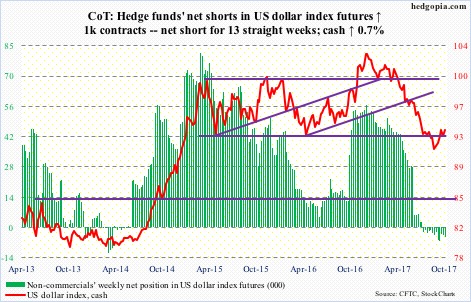
The cash (93.58) continues to struggle to get past near-term resistance at 94, but remains above broken-resistance-turned-support at 92.50-60. In a no-man’s land – kind of. The 50-day lies at 92.77.
Non-commercials continue to act hesitant in building net longs.
VIX: Currently net short 168.6k, down 6.1k.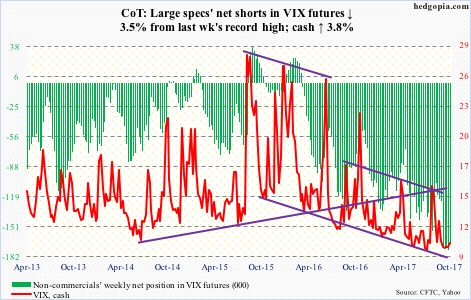
In a typical sign of the times, the cash (9.97) rallied to 11.77 intraday Thursday but only to close down 0.02 to 10.05. Intraday in that session, it rallied past both the 50- and 200-day, before volatility bears saw it as an opportunity to sell vol.
The bulls need to save shorter-term moving averages, with the 10- and 20-day at 10.01 and 9.84, respectively. This was more or less achieved Friday, as intraday VIX dropped to as low as 9.29. The session produced a dragonfly doji, following Thursday’s gravestone dojj – two contrasting signals back-to-back.
Thanks for reading!
