
Following futures positions of non-commercials are as of Oct 31, 2017.
10-year note: Currently net long 2.7k, down 150.9k.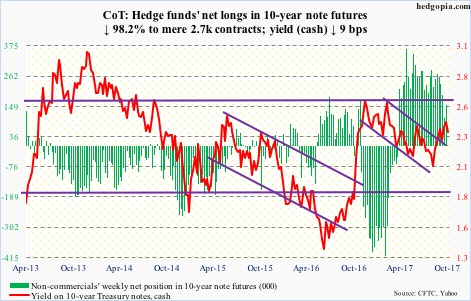
So Jerome Powell, current Fed governor, it is – the next chair. He is supposedly a dove – along the lines of outgoing Chair Janet Yellen – although his monetary policy instincts are not very clear. There is this, though. During his time at the Fed (since 2012), he has never dissented with the FOMC’s monetary policy decisions.
For President Trump, Powell, a Republican but appointed by President Obama, is a safe choice. Others in the running included John Taylor, Stanford economist, and Kevin Warsh, former governor – both billed as hawks.
By appointing Powell, Trump is also letting us know that he likes the status quo. During the campaign, he was very critical of the Fed’s easy monetary policy. Now, a more restrictive monetary policy can potentially hurt the economy. He also has three seats to fill in the seven-member Federal Reserve Board. Plus, he already nominated Randal K. Quarles.
From assets’ perspective, this is a victory – if it can be called that – for equity bulls in that Powell in all likelihood would not try to rock the boat. In the past, Trump has tweeted about how stocks have done well since his victory. The wealth effect and all.
As things stand, the glacial pace of tightening likely continues. With four 25-basis-point hikes since December 2015, December (12-13) is a lock, with the futures market pricing in 97-percent odds of a 25-basis-point rise. Yellen will have another opportunity in January next year before she leaves.
For equities, more important perhaps is the Fed’s decision to shrink its massive $4.5-trillion balance sheet beginning last month – by $10 billion/month to start and rising every three months in $10-billion increments until the amounts reach $50 billion/month, which will be reached next October. In due course, this can begin to bite.
30-year bond: Currently net long 12.7k, down 26k.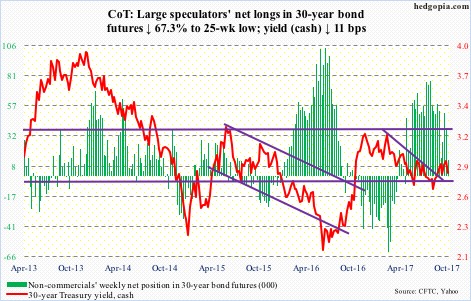
Major economic releases next week are as follows.
Tuesday brings the NFIB optimism index (October), JOLTS (September), and consumer credit (September).
Small-business optimism fell 2.3 points month-over-month in September to 103, although August was a hair’s breadth away from 12-year-high 105.9 in January this year. Optimism took off post-presidential election last November, with the last 10 months north of 105. September job openings fell a point m/m to 30, having peaked at 35 in July, which was the highest since November 2000.
Non-farm job openings in August fell 58,000 from July’s record 6.14 million.
Consumer credit rose $13.1 billion m/m in August to a seasonally adjusted annual rate of $3.77 trillion. Since Great Recession ended, consumers have borrowed $1.18 trillion. During the period, revolving credit (credit-card loans) went from $964.3 billion to $999.7 billion, student loans from $712.3 billion to $1.45 trillion, and auto loans from $742 billion to $1.09 trillion (student and auto loans are as of June).
The preliminary estimate of November’s University of Michigan’s consumer sentiment index is published Friday. Sentiment shot up six points in October to 101.1 – the highest since January 2004. In October last year – pre-election – sentiment was 87.2.
Crude oil: Currently net long 540.6k, up 71.7k.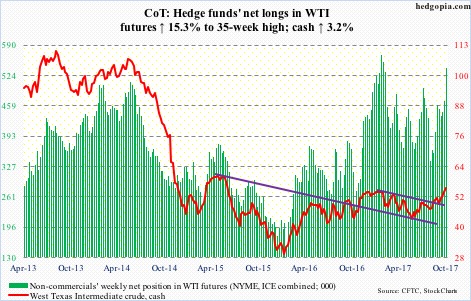
Spot West Texas Intermediate crude ($55.64/barrel) further built on last Friday’s break out of resistance at $52-$53, rallying all along the rising daily upper Bollinger band.
Non-commercials are fully in it, having taken net longs to a 35-week high.
In the event of downward pressure, first line of support is the breakout retest. Plus, shorter-term moving averages are still rising. Ditto with the 50-day.
The EIA report for the week ended October 27 – out Wednesday – contained several positives, particularly as relates to inventories.
Crude stocks fell 2.4 million barrels to 454.9 million barrels – the lowest since January last year.
Gasoline stocks dropped four million barrels to 212.8 million barrels. This was the lowest since August 2015.
Distillate stocks declined 320,000 barrels to 128.9 million barrels, which was the lowest since May 2015.
Crude imports decreased 552,000 barrels per day to 7.57 million b/d.
Refinery utilization inched up three-tenths of a point to 88.1 percent.
Crude production, however, rose 46,000 b/d to 9.55 mb/d.
E-mini S&P 500: Currently net long 161.3k, up 34.2k.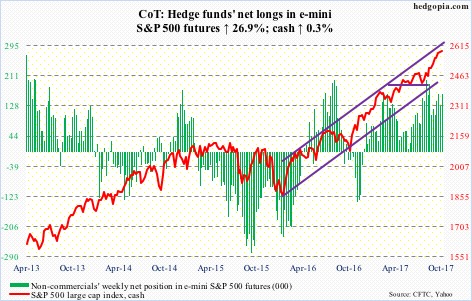
In the week to Wednesday, SPY (SPDR S&P 500 ETF) experienced outflows in all five sessions, totaling $5.1 billion (courtesy of ETF.com). VOO (Vanguard S&P 500 ETF) and IVV (iShares core S&P 500 ETF), however, saw combined inflows of $2.9 billion to minimize the damage.
In the same week, another $3.6 billion moved into U.S.-based equity funds, following inflows of $13 billion in the prior three (courtesy of Lipper).
Despite these flows, momentum arguably is decelerating. The cash did rise to an all-time high of 2588.42 Friday, with eight consecutive weekly gains, but once again the bulls were forced to defend the 20-day Thursday.
Euro: Currently net long 72.1k, down 11.4k.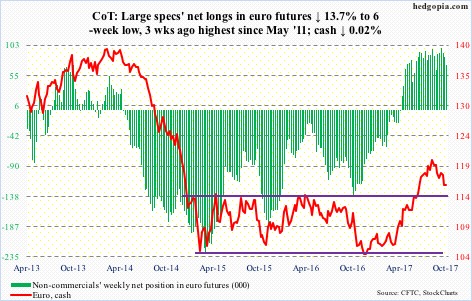
After last Friday’s doji session bottoming at $115.75, the cash ($116.07) rallied a tad, but remains below broken-support-turned-resistance at $116.70, which was tested several times during the week. The 10-day lies a little above, at $116.78.
In the event of more downward pressure, there is support at $114.50-ish, which it broke out of in July.
Gold: Currently net long 193.1k, up 1.7k.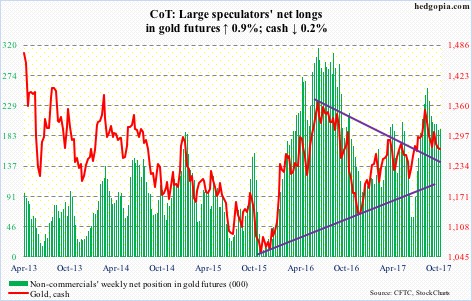
After seeing no activity for 13 straight sessions, GLD (SPDR gold ETF) saw some in the week to Wednesday – outflows in three sessions totaling $145 million. IAU (iShares gold trust), however, witnessed inflows of $49 million (courtesy of ETF.com).
The cash ($1,269.20/ounce) continues to trade between the 50- and 200-day – $1,299.63 and $1,261.49, respectively. The metal has not lost the 200-day since mid-July this year. The 50-day also coincides with resistance at $1,300.
Nasdaq 100 index (mini): Currently net long 42k, up 6.6k.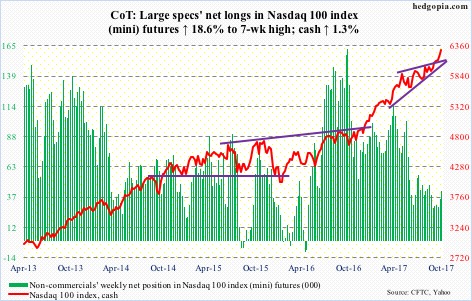
The break out of 6000 on the cash (6295.58) a month ago, followed by a successful retest eight sessions ago, seems to have emboldened the bulls.
In the week to Wednesday, QQQ (PowerShares QQQ trust) took in $1.7 billion. This followed inflows of $306 million in the prior week (courtesy of ETF.com).
The Nasdaq 100 rose to a new all-time high of 6297.62 Friday. The rally is dominated by large-caps.
On October 6, 77.8 percent of Nasdaq stocks were above their respective 50-day. Friday, only 54.6 percent were, even as both the Nasdaq composite and the Nasdaq 100 are at highs. On the daily chart, this metric is oversold, and can rise near term.
Russell 2000 mini-index: Currently net long 6k, down 9k.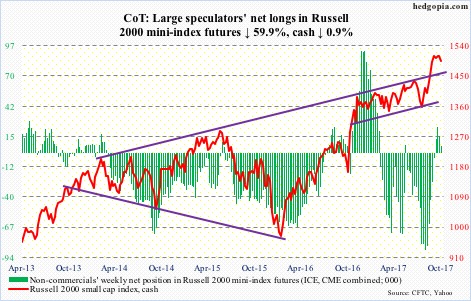
The cash (1494.91) on Wednesday came within 2.54 points of the all-time high of 1514.94 a month ago and got rejected, resulting in a candle with a very long wick. IWM (iShares Russell 2000 ETF), in fact, produced a huge bearish engulfing candle in that session.
Since that high on October 5, the Russell 2000 has been trading within a descending channel, and has slightly lost both 10- and 20-day.
Thus far, this has not discouraged flows. In the week through Wednesday, per ETF.com, $918 million went into IWM and $56 million into IJR (iShares core S&P small-cap ETF). This followed combined inflows of $688 million in the prior week.
In the past eight sessions, the bulls defended 1485-ish three times. Another wave of selling likely begins once this support gives way. On the weekly chart, there is plenty of room for the index to continue lower.
US Dollar Index: Currently net short 820, down 3.4k.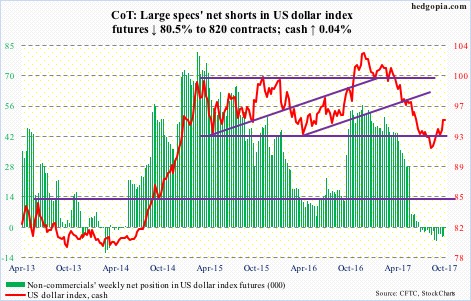
The cash (94.86) went from 90.99 on September 8 to last Friday’s high of 95.06. For continued momentum, the US dollar index would have probably liked to see a hawk like John Taylor as new Fed chief.
The index is still above 94, which it recently broke out of seven sessions ago. This also represents the neckline of an inverse head-and-shoulders formation, a completion of which measures to 97.
Non-commercials are just about flat, and have been cutting back net shorts.
Near term, the daily chart is beginning to look extended, with dollar bulls needing to defend 94 on the cash, which by the way was defended Friday with a low of 94.11.
VIX: Currently net short 145.3k, down 3.4k.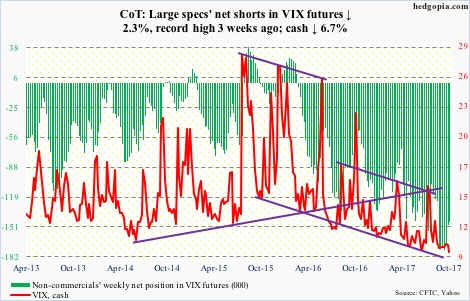
The cash (9.14) sought to rally past the 50-day in three sessions, but was rejected. In four out of five, VIX dipped sub-10 intraday, going even sub-nine Friday.
On a weekly basis, VIX has closed sub-10 for seven consecutive weeks. Talk about volatility suppression.
The VIX-to-VXV ratio closed out the week at .736, which was the lowest since mid-August 2012.
Amidst all this, non-commercials have been quietly reducing net shorts. Not a whole lot, but a reduction nonetheless – from record 174,665 contracts three weeks ago to 145,300.
Friday, VIX closed right on the daily lower Bollinger band. At least a bounce is due.
Thanks for reading!
