
Following futures positions of non-commercials are as of December 12, 2017.
10-year note: Currently net long 44.7k, up 30.4k.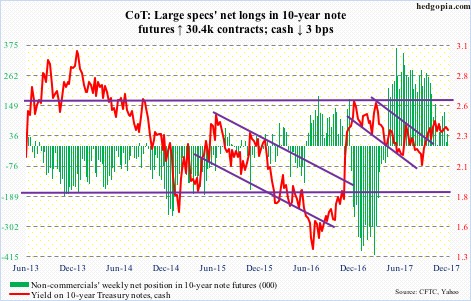
The Fed and the Administration are not on the same page when it comes to expected growth in the U.S. economy. One is way too optimistic than the other.
The FOMC this Wednesday raised the fed funds rate by 25 basis points to a range of 1.25 percent to 1.5 percent. Beginning in January, the Fed would also step up the monthly pace of shrinking its balance sheet to $20 billion from $10 billion, as scheduled.
Per the dot plot, the median estimate for economic growth next year jumped to 2.5 percent from 2.1 percent.
This follows actual growth of 3.3 percent and 3.1 percent in the last two quarters. As of Thursday, the Atlanta Fed’s GDPNow model put 4Q17 growth at 3.3 percent.
FOMC members, however, view this recent surge in growth as transient.
They expect growth to come back down to 2.1 percent in 2019 and two percent in 2020, and, importantly, their median forecast for long-run expansion was left unchanged at 1.8 percent. This massively diverges from what the Trump administration expects – GDP growth to increase gradually to three percent by 2020.
In all probability, even after proposed tax cuts are signed into law, the Administration’s forecasts are pie-in-the-sky optimism.
Going all the way back to 2Q47, GDP growth has averaged 3.2 percent. And post-Great Recession, growth has only averaged 2.2 percent. Sustained growth in the three-percent range would be welcome, but this late in the cycle to expect one would be unrealistic.
30-year bond: Currently net long 100.9k, up 26.4k.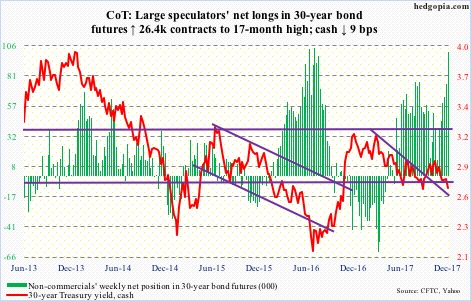
Major economic releases next week are as follows.
December’s NAHB housing market index is scheduled for Monday. Builder sentiment rose two points month-over-month to 70 in November. March’s 71 was the highest since 72 in June 2005.
Housing starts for November come out Tuesday. Starts surged 13.7 percent m/m in October to a seasonally adjusted annual rate of 1.29 million units. In October 2016, they reached 1.33 million – the highest since August 2007.
Existing home sales for November are on tap Wednesday. October sales rose 2.1 percent m/m to 5.48 million (SAAR). The cycle high 5.7 million – the highest since 5.79 million in February 2007 – was reached in March this year.
GDP (3Q17, final estimate) and corporate profits (3Q17, revised) will be reported Thursday.
The second estimate showed real GDP grew 3.3 percent in 3Q17.
Preliminarily, 3Q17 corporate profits adjusted for inventory valuation and capital consumption increased 5.4 percent year-over-year to $2.22 trillion (SAAR). Profits peaked at $2.23 trillion in 4Q14.
Friday brings durable goods (November), personal income and outlays (November), new home sales (November) and the University of Michigan’s consumer sentiment (December, final).
Orders for non-defense capital goods ex-aircraft – proxy for business capital expenditures – jumped 9.3 percent y/y in October to $66.9 billion (SAAR). After peaking at $70.3 billion in September 2014, orders bottomed at $59.9 billion in May 2016. October orders only inched up 0.3 percent m/m.
Core PCE – the Fed’s favorite measure of consumer inflation – rose 1.4 percent y/y in October. The last time this metric grew with a two handle was in April 2012.
October new home sales jumped 6.2 percent m/m to 685,000 units (SAAR) – a decade high.
The preliminary estimate showed consumer sentiment fell 1.7 percentage points m/m in December to 96.8. October’s 100.7 was the highest since 103.8 in January 2004.
Crude oil: Currently net long 654k, down 785.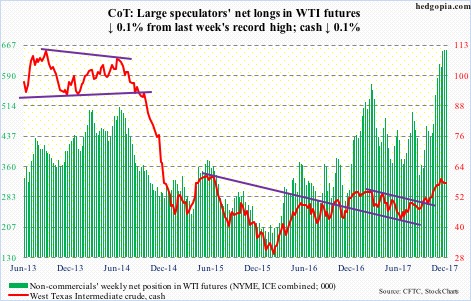
The 100-mile-long Forties pipeline – the North Sea’s most important, transporting 450,000 barrels per day – was shut down for at least a couple of weeks after Ineos, the owner, discovered a widening crack.
Crude oil was bid up on the news, but both spot West Texas Intermediate crude and the Brent were unable to hang on to the gains.
The WTI ($57.33/barrel) in particular has made lower highs since peaking at $59.05 on November 24. There is currently a tug of war between the bulls and bears around shorter-term moving averages. The former camp cannot afford to lose support at $54-55. The 50-day lies at $55.12.
Non-commercials hold near-record net longs. The risk at this stage is if and when they decide to unwind.
In the meantime, as per the EIA report for the week of December 8, U.S. crude production continued to increase – up 73,000 b/d to 9.78 million b/d. Since OPEC and Russia reached a deal in November last year to cut production by 1.8 mb/d, U.S. production has gone up by 1.08 mb/d.
Gasoline stocks rose as well, up 5.7 million barrels to 226.5 million barrels. Ditto with crude imports, which increased 161,000 b/d to 7.36 mb/d.
Refinery utilization inched down four-tenths of a point to 93.4 percent.
Distillate stocks, however, dropped 1.4 million barrels to 128.1 million barrels. As did crude stocks, which fell 5.1 million barrels to 443 million barrels – the lowest since October 2015.
E-mini S&P 500: Currently net long 67.7k, down 99.2k.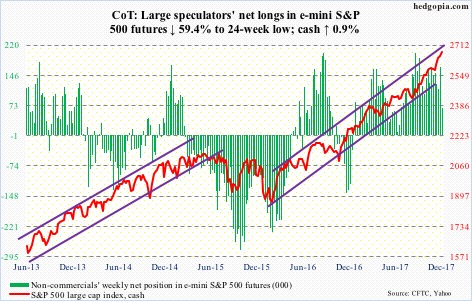
Flows continued to stream into S&P 500-focused ETF’s. In the week ended Wednesday, SPY (SPDR S&P 500 ETF) took in a massive $11.4 billion (courtesy of ETF.com). Another $935 million went into IVV (iShares core S&P 500 ETF), and VOO (Vanguard S&P 500 ETF) attracted $539 million. This followed combined inflows of $6.4 billion in the prior week.
The cash (2675.81), essentially flat through Thursday, rallied 0.9 percent Friday on signs the tax measures would go through.
Interestingly, before this, non-commercials cut back big.
Also in the week through Wednesday, U.S.-based equity funds lost $16.2 billion. This followed inflows of $32.4 billion in the prior nine (courtesy of Lipper).
Elsewhere, XLF (SPDR financial sector ETF) produced a back-to-back spinning top candle. It is looking tired. Financials represent 15 percent of the S&P 500, second only to information technology’s just under 24 percent.
Euro: Currently net long 113.9k, up 20.8k.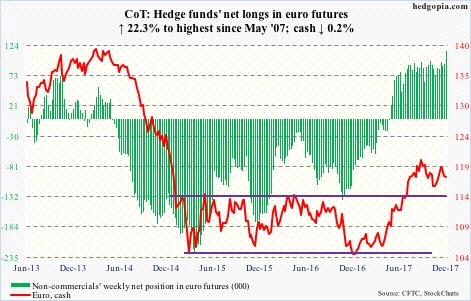
The European Central Bank raised its Eurozone growth forecasts through 2019, but reiterated its commitment to continue bond purchases at least until the end of next September. In October (this year), it cut in half monthly purchases to €30 billion.
Mario Draghi, ECB president, said Thursday they did not discuss a date to end the stimulus measures. The cash ($117.50) tried to rally in that session but ended down 0.4 percent. The 50-day ($117.60) has been lost.
The path of least resistance is toward support at $116.70-ish.
Gold: Currently net long 107.1k, down 66.3k.
Gold bugs put the foot down well before support at $1,200/ounce could be tested on the cash ($1,257.50). There is work ahead, though.
Both Thursday and Friday, the metal faced resistance at the underside of a broken trend line from December last year. Once this is broken through, the 200-day ($1,268.33) lies right above, followed by stiff resistance at $1,300.
There is room to rally near- to medium-term. Flows need to cooperate.
In the week to Wednesday, per ETF.com, IAU (iShares gold trust) took in $51 million, which was offset by outflows of $49 million from GLD (SPDR gold ETF).
More important is if non-commercials, having cut net longs to a 20-week low, begin to rebuild.
Nasdaq 100 index (mini): Currently net long 6.7k, up 566.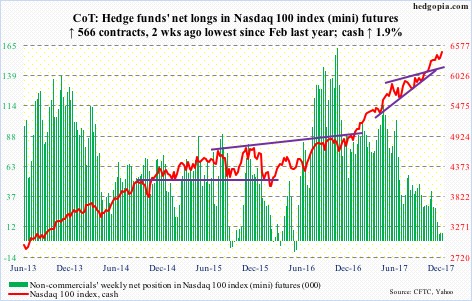
The cash (6466.32) experienced a mini-breakout Friday, but closed right at the daily upper Bollinger band.
At least until Tuesday, non-commercials were still showing caution. As did retail.
QQQ (PowerShares QQQ trust) in the week through Wednesday lost $123 million (courtesy of ETF.com). This comes on the heels of loss of $1 billion in the prior two.
Russell 2000 mini-index: Currently net long 41.4k, up 684.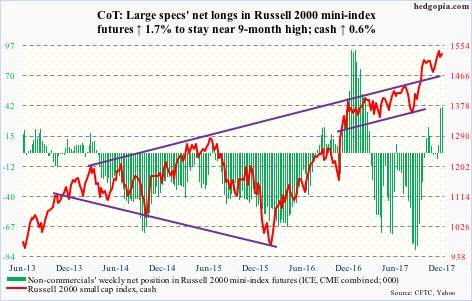
Rally attempts in the first three sessions were persistently rejected at the 10-day, before the bulls lost that average in Thursday’s 1.2-percent decline, only to be recaptured in Friday’s 1.6-percent surge. Confusing! The 50-day was tested but saved.
IWM (iShares Russell 2000 ETF) in the week through Wednesday lost $1.8 billion. IJR (iShares core S&P small-cap ETF) lost another $53 million (courtesy of ETF.com). But it seems non-commercials are winning this battle for now. They aggressively went net long last week, and stayed with it this week.
US Dollar Index: Currently net short 5.7k, up 2.8k.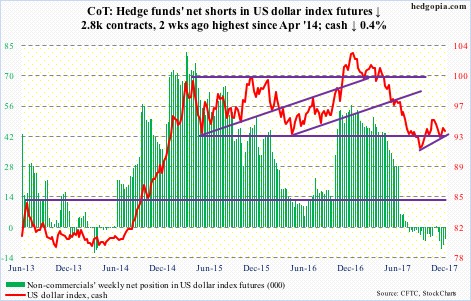
Resistance at 94 and change once again proved too tough to crack. Tuesday, the cash (93.46) rallied to 94.21, but only to be followed by a reversal, slicing through the 50-day.
The latest rally came off of the bulls’ defense of range support at 92-93. This now also approximates the daily lower Bollinger band.
Non-commercials continue to remain on the sidelines.
VIX: Currently net short 122.1k, up 7.5k.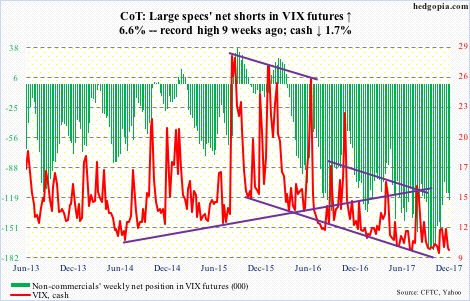
After dropping to 9.21 intraday Tuesday, the cash (9.42) rallied in the next three sessions, only to get rejected at the 50-day. Yet another instance of volatility sellers ruling the game.
Just to get a sense of the prevailing complacency, the 21-day moving average of the CBOE equity put-to-call ratio dropped to 0.583 Friday, which was the lowest since July 2014. In the meantime, the ISEE index (equity) Thursday rose to 157.1 – the highest since May 2015.
Thanks for reading!
