
Following futures positions of non-commercials are as of February 20, 2018.
10-year note: Currently net short 214.5k, down 82.5k.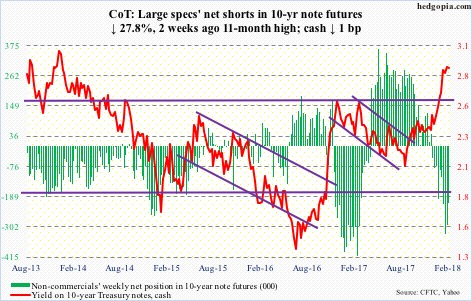
Three percent on the 10-year Treasury note is a closely watched level by many. If it is surpassed, stops likely get taken out, putting yields under further upward pressure. For now, bond bears are at least aiming for that. Post-FOMC minutes Wednesday, yields rose to 2.94 percent, before retreating the next two sessions.
Here is the thing.
In less than six months, rates have also backed up quite a bit. The 10-year (2.87 percent) yielded 2.03 percent early September last year. In a leveraged economy, this in and of itself should help slow down economic activity. Plus, growth in M2 money supply is decelerating drastically.
It is hard to imagine the long end continuing on the current trajectory. At least a pause – if not an outright reversal – is probable. In fact, many fixed-income managers may find three percent – or thereabouts – on the 10-year an attractive level to go long bonds.
Near term, an equally important level to watch is 2.62 percent, which the 10-year broke out of in January. This also represents the neckline of a reverse-head-and-shoulders pattern. This is where a bull-bear duel likely gets fought.
30-year bond: Currently net long 17.4k, up 13.5k.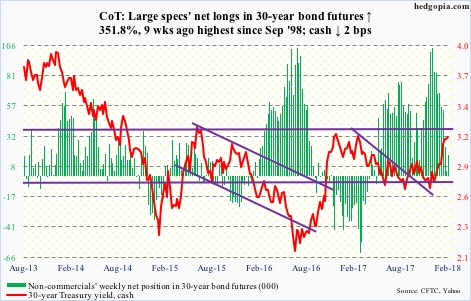
Major economic releases next week are as follows.
New home sales for January are due out Monday. December was down 9.3 percent month-over-month to a seasonally adjusted annual rate of 625,000 units. Last November’s 689,000 units were at a decade high.
On Tuesday, durable goods orders (January) and the S&P Corelogic Case-Shiller home price index (December) are published.
Orders for non-defense capital goods ex-aircraft – proxy for business capex plans – increased eight percent year-over-year in December to $66.9 billion (SAAR). Orders peaked at $70.3 billion in September 2014, and bottomed at $59.9 billion in March 2016.
Nationally, home prices rose 6.2 percent y/y in November. This was the fastest growth rate since June 2014.
Also on Tuesday, Jerome Powell, Fed chair, delivers his semi-annual Humphrey-Hawkins testimony to the Congress.
Wednesday brings GDP (4Q17; 2nd estimate) and the pending home sales index (January).
The first print showed real GDP grew 2.6 percent in 4Q17. This follows growth of 3.1 percent in 2Q and 3.2 percent in 3Q.
Pending home sales in December rose 0.5 percent m/m to 110.1 – a nine-month high.
Personal income and outlays (January) and the ISM manufacturing index (February) come out Thursday.
Core PCE – the Fed’s favorite measure of consumer inflation – rose 1.52 percent y/y in January. The last time this metric grew north of two percent was in April 2012.
Manufacturing activity inched down two-tenths of a point in January to 59.1. Last September’s 60.2 was the highest since June 2004.
The final print of February’s University of Michigan’s consumer sentiment index is on tap Friday. Preliminarily, sentiment jumped 4.2 points m/m to 99.9, just a hair’s breadth away from last October’s 100.7, which was the highest since January 2004.
Crude oil: Currently net long 773.6k, down 8.6k.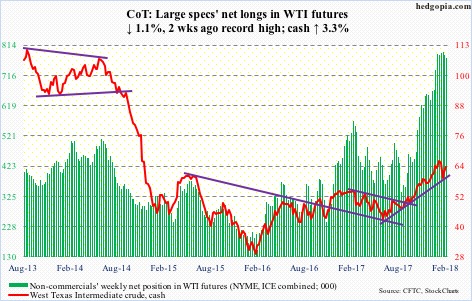
After defending support at $58-59/barrel last week, bulls this week further rallied spot West Texas Intermediate crude ($63.55), pushing off of the 10-day moving average and recapturing the 50-day. It essentially closed out the week at $63-63.50 resistance. The bulls are eyeing $66. The crude peaked at $66.66 on January 25.
The EIA report for the week ended February 16 – out Wednesday – must have helped the bullish sentiment.
U.S. crude production inched down 1,000 barrels per day to 10.3 million b/d.
Crude stocks, too, fell 1.6 million barrels to 420.5 million barrels. As did distillate stocks – down 2.4 million barrels to 138.9 million barrels. Gasoline stocks inched up 261,000 barrels to 249.3 million barrels.
Crude imports declined 867,000 b/d to seven mb/d – the lowest in 23 weeks.
Refinery utilization declined 1.7 percentage points to 88.1 percent.
E-mini S&P 500: Currently net long 113.3k, down 65.7k.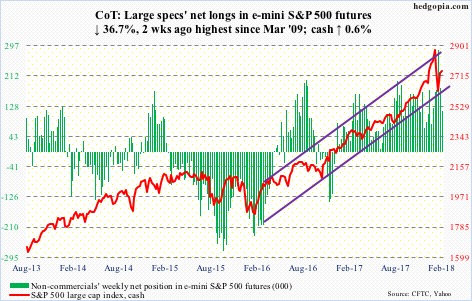
Last Friday, in a shooting star session the cash (2747.30) retreated intraday after hitting 2754.42. At 2743 also lied resistance representing a 61.8-percent Fibonacci retracement of the decline between 2872.87 on January 26 and 2532.69 on February 9.
This week, the S&P 500 index went after this, as well as the 50-day (2730.88), several times, all unsuccessfully. Until Friday when in a low-volume session the index jumped 1.6 percent. The bulls obviously would like to build on this. Let us see what next week brings.
In the week ended Wednesday, flows were not much of a help, as $4.2 billion came out of SPY (SPDR S&P 500 ETF) and another $329 million out of IVV (iShares core S&P 500 ETF). VOO (Vanguard S&P 500 ETF), however, gained $727 million (courtesy of ETF.com).
In the same week, U.S.-based equity funds (including ETFs) took in $1.1 billion. This followed outflows of $28.5 billion in the prior two (courtesy of Lipper).
Euro: Currently net long 126.1k, down 1.2k.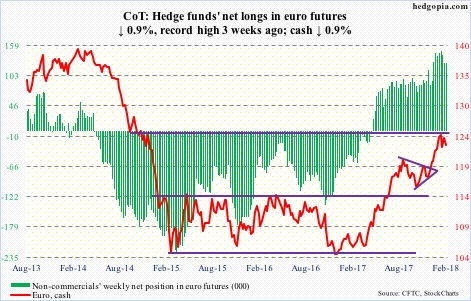
For the third time since it was first rejected on January 25, the cash ($122.95) Thursday last week failed at $125. It has since struggled. A falling trend line from the all-time high of $160.20 in April 2008 lies at/near $125. This also represents measured-move-target resistance of a 10-point range breakout last July.
On the weekly chart, there is room for it to continue lower. There is support at $120-121. The 50-day rests at $121.58.
Gold: Currently net long 190.9k, up 15.3k.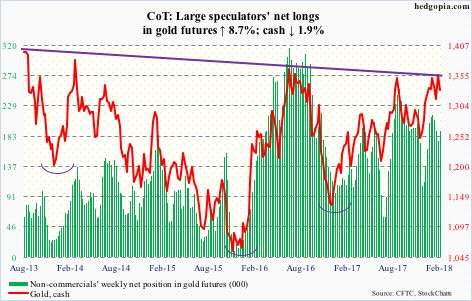
For the first time in four weeks, GLD (SPDR gold ETF) saw inflows, attracting $181 million in the week to Wednesday (courtesy of ETF.com). IAU (iShares gold trust) pulled in another $81 million. This was not enough to push the cash ($1,330.30/ounce) higher though, losing 1.9 percent for the week.
Last week, gold yet again failed at $1,360s. On January 25, the yellow metal retreated after hitting $1,365.40 – rejected at a slightly falling trend line from August 2013. This level also approximates the neckline of a reverse-head-and-shoulders formation. Then there is Fibonacci resistance. Gold peaked in September 2011 at $1,923.70, then bottoming at $1,045.40 in December 2015. A 38.2-percent retracement of this decline lies at $1,380.91.
A breakout would be massive. Until then, the bulls need to defend $1,300.
Nasdaq 100 index (mini): Currently net short 8.3k, down 2.1k.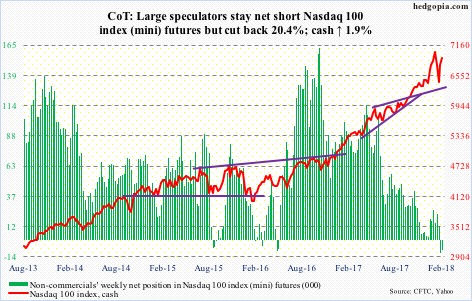
Of the major U.S. indices, the cash (6896.60) continues to perform better – relatively. It is comfortably above the 50-day (6659.70), and merely 1.8 percent from the all-time high of January 26.
Friday’s two-percent jump preceded sideways action in four sessions above the 20-day.
At least until the week through Wednesday, flows were a question mark, with QQQ (PowerShares QQQ ETF) losing another $839 million. This followed loss of $2.5 billion in the prior week (courtesy of ETF.com).
Russell 2000 mini-index: Currently net short 8.3k, down 47.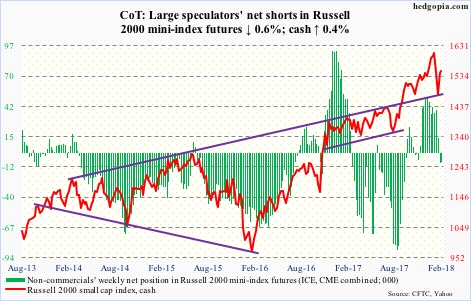
Small-caps, on the other hand, continue to act weak – relatively. The cash (1549.19) is yet to take out the 50-day (essentially closed out the week on it), with the average persistently offering resistance the past several sessions.
In the week to Wednesday, IJR (iShares core S&P small-cap ETF) gained $69 million, but this paled in comparison to $1.5 billion in outflows IWM (iShares Russell 2000 ETF) suffered (courtesy of ETF.com).
Next week, there is room for the index to push higher, but conviction is lacking in small-cap action.
US Dollar Index: Currently net short 2k, down 816.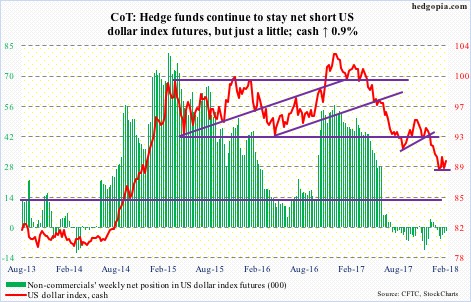
Support at 88-89 on the cash (89.81) goes back to at least July 1994. The intraday low of 88.25 on January 25 was slightly breached intraday Friday last week by $0.10 but held by close. This was a successful test of a rising trend line from May 2011.
Dollar bulls are putting their foot down in defense of this support. As long as this does not give way, they deserve the benefit of the doubt.
Near-term resistance lies at 90-90.50.
VIX: Currently net long 59.6k, down 15k.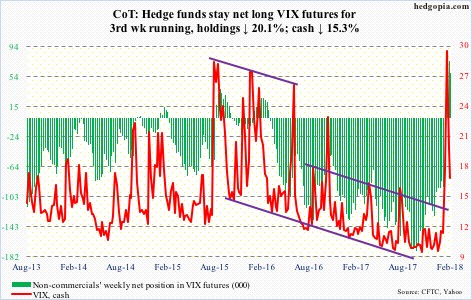
Volatility bulls need to step up.
After peaking on February 6 at an intraday high of 50.30, the cash (16.49) has come under genuine pressure. If there has been a change in VIX’s character and if it has entered a higher regime, then support at 15-16 should hold. Prior to the latest spike, VIX remained languished in the sub-10 or low-double-digit region for a long time.
For the third week running non-commercials have remained net long. In the past, as these traders unwound their optimism, the cash tends to come under pressure. Hence the significance of 15-16.
Thanks for reading!
