
Following futures positions of non-commercials are as of March 6, 2018.
10-year note: Currently net short 362.2k, up 19.3k.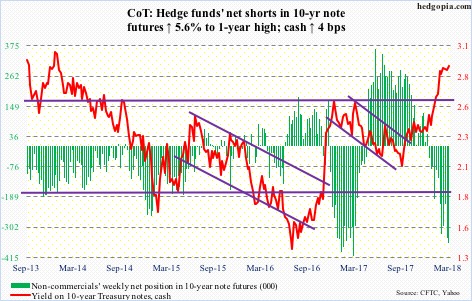
On February 2, January’s private-sector average hourly earnings were reported, and they rose 2.89 percent year-over-year, to $26.74. This was the fastest growth rate since wages increased 2.93 percent in May 2009. Markets freaked out, fearing wage-push inflation. Ten-year Treasury yields jumped eight basis points to 2.85 percent in that session. The S&P 500 large cap index plummeted 2.1 percent to 2762.13.
Fast forward to this Friday’s February report. The economy created much-better-than-expected 313,000 non-farm jobs, while January was revised up by 39,000 to 239,000. But wages disappointed. The January number which created such a panic in the markets was revised down to $26.71, now only up 2.77 percent y/y, while February only rose 2.61 percent. Ten-year yields rose three basis points to 2.89 percent. The S&P 500 rallied 1.7 percent to 2786.57.
A couple of things are worthy of note here. First, on both occasions, market reaction was swift – across asset classes. Hindsight is always 20/20, but now we know the first reaction was premature. January’s wages got revised downward, but how markets reacted back then cannot be rolled back. Second, between the reports, 10-year yields and the S&P 500 are essentially flat, give and take. Maybe markets have a way of getting it right eventually.
30-year bond: Currently net long 14.3k, down 13.2k.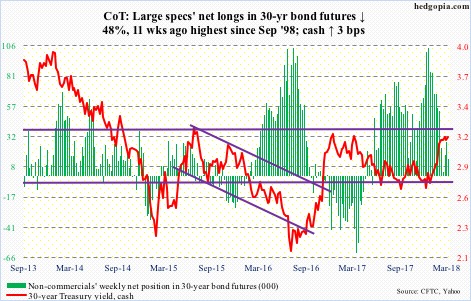
Major economic releases next week are as follows.
The NFIB optimism index (February) and CPI (February) are due out Tuesday.
Small-business optimism in January rose two points month-over-month to 106.9, just a hair’s breadth away from last November’s 34-year high 107.5.
January consumer prices increased 0.5 percent m/m and 2.1 percent in the 12 months to January. Over the same time period, core CPI rose 0.3 percent and 1.8 percent, respectively.
PPI-FD (February) and retail sales (February) are published Wednesday.
Producer prices for final demand increased 0.4 percent m/m in January. In the 12 months through January, prices rose 2.7 percent. Core PPI increased 0.1 percent m/m and 2.5 percent in the 12 months to January.
Retail sales fell 0.3 percent m/m in January to a seasonally adjusted annual rate of $492 billion. Sales rose 3.7 percent y/y, slower than 5.9 percent last November.
Thursday brings the NAHB housing market index (March) and Treasury International Capital data (January).
Homebuilder optimism in February remained unchanged at 72. Last December’s 74 was the highest since 75 in July 1999.
Foreigners in 2017 purchased $126.5 billion in U.S. equities and $20 billion in Treasury notes and bonds.
On tap for Friday are housing starts (February), industrial production (February), University of Michigan’s consumer sentiment index (March) and JOLTS (January).
Starts jumped 9.7 percent m/m in January to 1.33 million units (SAAR), essentially matching the level of October 2016.
Capacity utilization dropped 0.3 percent m/m in January to 77.5 percent. The cycle high 79.2 percent was reached in November 2014.
Consumer sentiment jumped four points m/m in February to 99.7. Last October’s 100.7 was the highest since 103.8 in January 2004.
Non-farm job openings fell 167,000 m/m last December to 5.81 million. The all-time high 6.18 million was recorded last September.
Crude oil: Currently net long 775.3k, down 11.8k.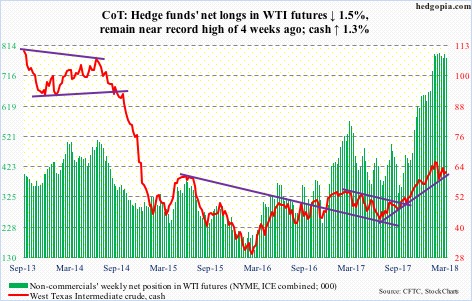
Spot West Texas Intermediate crude ($62.04/barrel) continues to be in no man’s land.
Resistance at $63-$64 once again repelled rally attempts this week, with the crude rallying to $63.28 intraday in a doji session Tuesday. The 50-day has once again been lost – but barely – and a pattern of lower highs has developed since peaking late January/early February.
In the meantime, the bulls have carved out new short-term support at $60. There is additional support at $58-59.
The EIA report for the week ended March 2 continued to show a buildup in crude production, up 86,000 barrels per day to 10.4 million bpd. Ditto with crude stocks and imports – up 2.4 million barrels and 721,000 b/d to 425.9 million barrels and eight mbpd, respectively.
Gasoline and distillate stocks, however, fell – down 788,000 and 559,000 barrels to 251 million barrels and 137.4 million barrels, in that order.
Refinery utilization inched up two-tenths of a point to 88 percent.
E-mini S&P 500: Currently net long 128.9k, up 32.5k.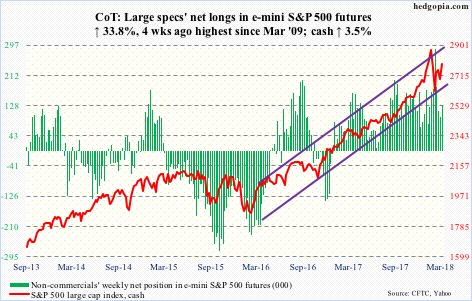
After peaking at 2872.87 on January 26, the cash (2786.57) quickly fell to 2532.69 on February 9, before reversing higher. In the subsequent sessions, a pennant developed, which has now been broken to the upside. Near-term, the bias remains up.
At least until Wednesday, flows were still leaning cautious. In the week ended that session, SPY (SPDR S&P 500 ETF) lost $10.4 billion, way more than what went into IVV (iShares core S&P 500 ETF) and VOO (Vanguard S&P 500 ETF) – $426 million and $559 million, respectively (courtesy of ETF.com).
In the same week, U.S.-based equity funds (including ETFs) lost $9.8 billion (courtesy of Lipper.com). Over the past month, $23.9 billion has been withdrawn.
Euro: Currently net long 133k, down 5k.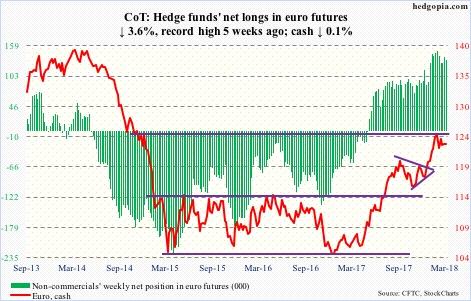
The ECB Thursday dropped its easing bias. In the post-meeting statement, the bank no longer explicitly committed to expanding its bond-buying program in case the Eurozone economic outlook worsened. The current program runs through September.
The cash ($123.07) apparently tried to rally on this development, but reversed hard to end the session down 0.8 percent.
Over three weeks in January and February, there were several unsuccessful attempts at $125. A falling trend line from the all-time high of $160.20 in April 2008 lies near that level, which also represents measured-move-target resistance of a 10-point range breakout last July.
A pattern of lower highs is now in place. The still-rising 50-day ($122.57) lies underneath, and after that support at $121-122.
Gold: Currently net long 183.8k, up 5.1k.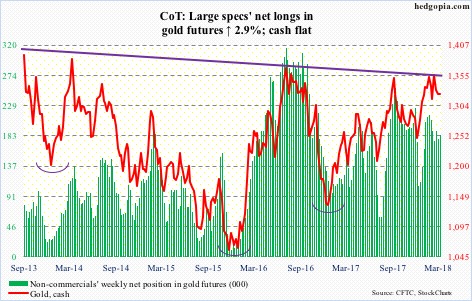
In the week to Wednesday, GLD (SPDR gold ETF) took in $125 million, while IAU (iShares gold trust) lost $38 million (courtesy of ETF.com).
For the week, the cash ($1,324/ounce) was flat as a pancake.
The metal has gone back and forth between $1,300 on the down and $1,360s/1,370s on the up for 10 months now. After bouncing off that support Thursday last week, gold rallied past the 50-day, but only to quickly give it back. It is currently stuck in the middle of the range.
Nasdaq 100 index (mini): Currently net long 5.9k, up 3.1k.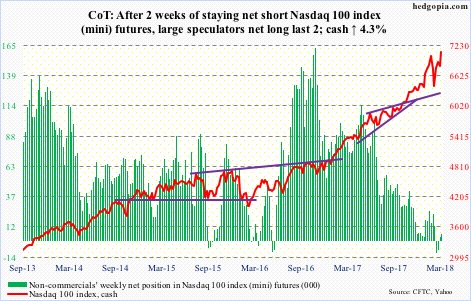
Of major U.S. equity indices, the cash (7101.18) is the first to break out to a new high after the February correction.
The Nasdaq 100 peaked at 7022.97 on January 26. That level was tested again on February 27 as it rallied to 7003.13. The breakout occurred this Friday. Price action is good.
The knock on this is that the rally continues to be driven by large-caps. And that at least in the week to Wednesday QQQ (PowerShares QQQ ETF) saw outflows of $394 million, as opposed to inflows of $2.7 billion in the prior week (courtesy of ETF.com). That said, Thursday already attracted $735 million. It is possible this continued Friday.
Russell 2000 mini-index: Currently net short 1.9k, down 2.6k.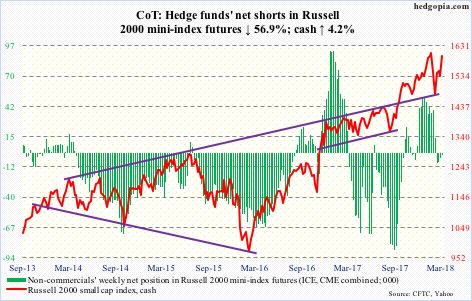
Rightly or wrongly, for now the crowd has concluded that small-caps because of their domestic focus will remain immune from the repercussions of President Trump’s imposition of 25 percent tariffs on steel imports and 10 percent for aluminum.
Amidst mini-selloff early last week, small-cap bulls put their foot down Thursday as Trump’s trade tweets began to fan fears of a trade war. This week, the cash (1597.14) proceeded to rally past the 50-day (1552.55), and is now within striking distance of the January 24 all-time high of 1615.52. This without much help from ETF flows.
In the week to Wednesday, IWM (iShares Russell 2000 ETF) lost $660 million, even as IJR (iShares core S&P small-cap ETF) gained $131 million (courtesy of ETF.com). Although Thursday, there was a role reversal, with IWM taking in $423 million and IJR losing $110 million.
US Dollar Index: Currently net short 121, down 2k.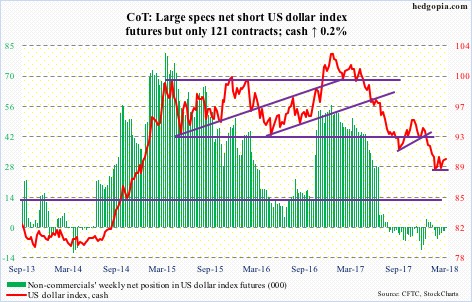
Short-term support at 89.40 was defended both Wednesday and Thursday this week. Although the 50-day (90.20) came in the way Friday. Resistance also lies at 90.50, and after that just under 91.
As long as 88-89 holds on the cash (90.07), the bulls can view the action over the past month and a half as constructive.
VIX: Currently net long 76.9k, up 42.5k.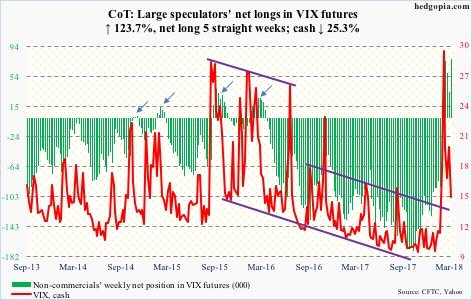
The cash (14.64) continued to unwind this week. Support at 15-16 was lost Friday. As was the 50-day. The 200-day (12.04) lies underneath.
In the first week of February when VIX massively spiked, U.S. high-yield spreads over Treasurys acted calm. This non-confirmation, followed by loss of support on VIX, is raising the odds that volatility is still headed lower.
Non-commercials are still massively net long VIX futures. In past is prologue (arrows in the chart), as they unwind and eventually go net short, the cash has tended to come under pressure.
Thanks for reading!
