
Following futures positions of non-commercials are as of March 13, 2018.
10-year note: Currently net short 271.4k, down 90.8k.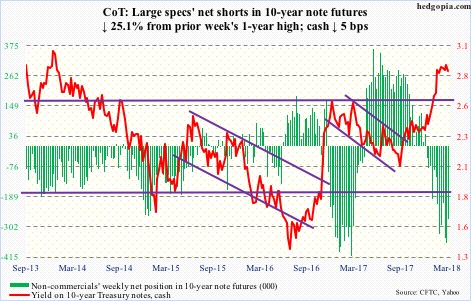
Once again, 10-year Treasury yields are retreating from important resistance. Caught in a three-decade-old descending channel, the 10-year rate came very close to breaking out, rising to 2.94 percent on February 21. This was preceded by a relentless rally from 2.03 percent on September 7 last year.
Fatigue may have set in at an important juncture.
In the right circumstances, the weekly chart has plenty of room to head lower. Economic growth is in deceleration, and this can impact these yields.
Near-term, though, it is looking like a coin toss. Yields this week found support at the daily lower Bollinger band, even as the daily chart is beginning to look oversold.
Whatever happens near term, a crucial test likely lies ahead. In due course, a breakout retest of 2.62 percent looks imminent. This was a level reached in December 2016, and then again in March 2017, before it was taken out in January this year. What happens around this level will dictate price action for the foreseeable future.
Non-commercials cut back this week, but they are still heavily net short. This is a potential source of headwind for yields (cash), should these traders continue to cover.
30-year bond: Currently net long 83.6k, up 69.3k.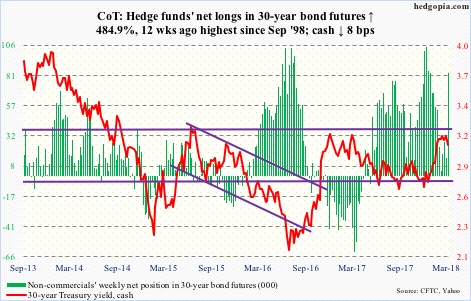
Major economic releases next week are as follows.
FOMC meeting – the year’s second – begins Tuesday, and ends the next. A 25-basis-point hike is priced in. Markets are probably more focused on what the dot plot conveys.
Post-December 2017 meeting, members expected three hikes this year. After January’s employment report, which at the time showed average hourly earnings rose by a faster-than-expected 2.89 percent, some market participants began to even toy with the idea of four hikes. Two weeks ago when February’s numbers were reported, the January increase was revised down to 2.77 percent, with February only up 2.61 percent. Depending on how the members view this, as well as recent uptick in inflation and inflation expectations, the dot plot can change – may even have an upward bias. Hence its significance for the markets, which are yet to price in four hikes.
Existing home sales for February come out Wednesday. Sales in January fell 3.2 percent month-over-month to a seasonally adjusted annual rate of 5.38 million units. Last November’s 5.72 million was the highest since 5.79 million in February 2007.
On tap for Friday are durable goods orders (February) and new home sales (February).
Non-defense capital goods ex-aircraft – proxy for business capex plans – rose 6.3 percent year-over-year to $66.7 billion (SAAR). Growth has decelerated from last October’s 9.9 percent. Orders peaked at $70.3 billion in September 2014, and have risen since $59.9 billion in May 2016. Most recently, they peaked at $67.3 billion last November.
January new home sales dropped 7.8 percent m/m to 593,000 units (SAAR). November’s 696,000 units were the highest since 727,000 in October 2007.
Crude oil: Currently net long 758.7k, down 16.6k.
On Wednesday, the day the EIA report for the week ended March 9 was out, oil bulls defended short-term support at $60/barrel on spot West Texas Intermediate crude ($62.41).
The crude continues to trade around the 50-day moving average; in fact, it closed out the week right under ($62.66). This level also approximates a falling trend line from early last month. This is an opportunity for the bulls to break a month-and-a-half-long pattern of lower highs. A failure will bring $60 into play again. After that, there is support at $58-59. The latter is a must-hold.
In the said week, crude production increased another 12,000 barrels per day (b/d) to 10.4 million b/d. Crude stocks, too, rose, up five million barrels to 430.9 million barrels.
Crude imports, however, dropped 418,000 b/d to 7.6 mb/d. Ditto with gasoline and distillate stocks – down 6.3 million barrels and 4.4 million barrels to 244.8 million barrels and 133.1 million barrels, respectively. Refinery utilization rose two percentage points to 90 percent.
E-mini S&P 500: Currently net long 122.1k, down 6.8k.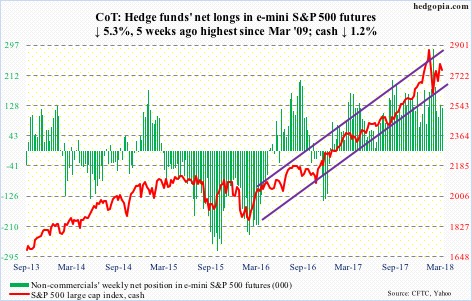
The bull market in stocks just completed nine years.
The bulls this week were unable to build on last week’s pennant breakout on the cash (2752.01). Rather, the bears forced a test of the 50-day (2748.85). The reversal came early this week when the S&P 500 got rejected at the daily upper Bollinger band. Currently, it is in the middle of the bands, clinging on to the 50-day.
Since the February 9 low, the index has carved out higher lows. A rising trend line from that low lies around 2720. It will be an important test.
Rather discouragingly for the bulls, the action this week came in the midst of decent flows.
In the week to Wednesday, $8.3 billion moved into SPY (SPDR S&P 500 ETF), while VOO (Vanguard S&P 500 ETF) and IVV (iShares core S&P 500 ETF) took in $724 million and $917 million, in that order (courtesy of ETF.com).
In the same week, U.S.-based equity funds (including ETFs) gained $20.4 billion (courtesy of Lipper.com).
Euro: Currently net long 146.4k, up 13.4k.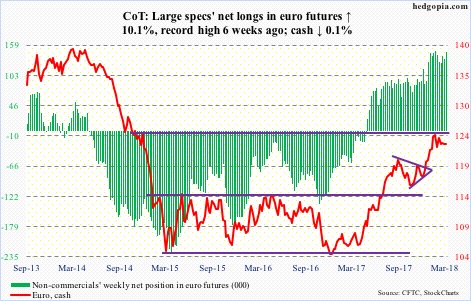
On the weekly chart, the cash ($122.96) has been producing bearish-looking candles with long wicks.
The euro retreated on January 25 after hitting $125.37, and has since carved out lower highs.
Over three weeks in January and February, there were several unsuccessful attempts at $125. A falling trend line from the all-time high of $160.20 in April 2008 lies there. This level also represents measured-move-target resistance of a 10-point range breakout last July.
The daily chart is itching to go lower, with the currency literally sitting on the 50-day ($122.92). After that, there is support at $121-122. The daily lower Bollinger band rests at $122.14.
Gold: Currently net long 167.9k, down 15.9k.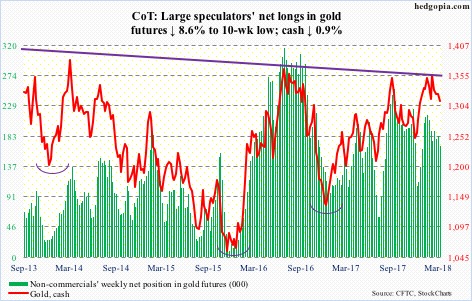
In nine sessions through Wednesday, GLD (SPDR gold ETF) and IAU (iShares gold trust) saw no activity whatsoever (courtesy of ETF.com). This changed Thursday when they respectively gained $188 million and $29 million, but was not enough.
For nearly three weeks now, the cash ($1,312.30/ounce) pretty much straddled the 50-day ($1,330.75), which is now flattish to slightly declining. Hence the significance of the bottom of the range the metal has been in the past 11 months – $1,300 on the down and $1,360s/1,370s on the up. The low end, which was defended two weeks ago, also approximates the daily lower Bollinger band.
Nasdaq 100 index (mini): Currently net long 19.1k, up 13.2k.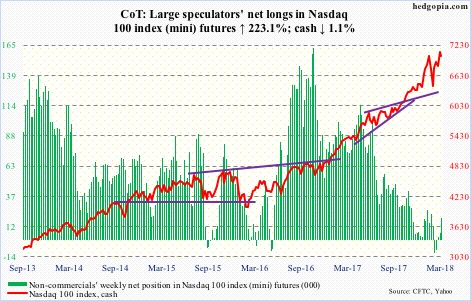
No sooner did the cash (7019.95) rallied to a new high than a breakout retest occurred. Tuesday’s intraday high of 7186.09 came in a bearish engulfing session.
The daily chart is in a process of unwinding its overbought condition. In the right circumstances, the weekly – or even monthly – could do the same. For this scenario to pan out, both the 10- and 20-day need to at least begin to go flat and then roll over.
For now, last Friday’s breakout probably helped attract flows. QQQ (PowerShares QQQ ETF) in the week to Wednesday saw inflows of $3.1 billion (courtesy of ETF.com).
Russell 2000 mini-index: Currently net long 7.6k, up 9.5k.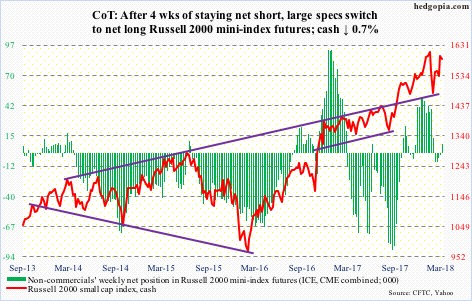
After an eight-session, 7.7-percent intraday rally, the cash (1586.05) Tuesday came within 6.47 points of the all-time high of 1615.52 on January 24, and was rejected. The subsequent decline is yet to test support at 1550, which also approximates the 50-day (1556.74).
Small-caps benefited from investor/trader perception – rightly or wrongly – that President Trump’s imposition of 25 percent tariffs on steel imports and 10 percent for aluminum will benefit these companies because of their domestic focus.
Flows cooperated as well. In the week to Wednesday, IWM (iShares Russell 2000 ETF) attracted $2 billion, even as IJR (iShares core S&P small-cap ETF) lost $165 million (courtesy of ETF.com).
The real test for the bulls lies when a test of the aforementioned support occurs.
US Dollar Index: Currently net long 847, up 968.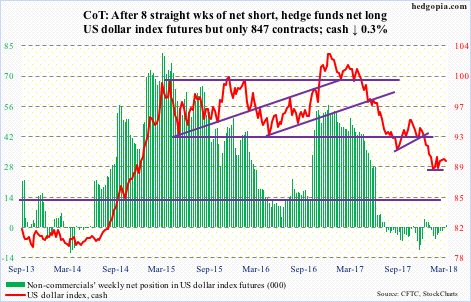
Short-term support at 89.40, as well as multi-year support at 88-89, was tested Thursday, and it held (low of 89.14). That said, the cash (89.80) remains under the 50-day (89.97), but barely. Month-to-date, the average – slightly declining – has so far repelled rally attempts six times. Hence its significance. Once it is won over, resistance lies at 90.50, and after that just under 91.
VIX: Currently net long 53.6k, down 23.3k.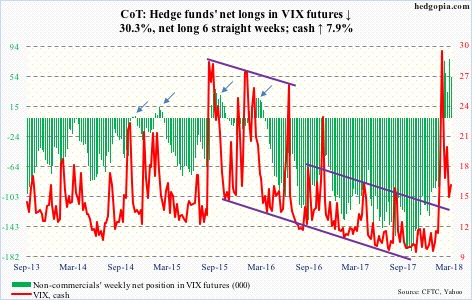
Indicators such as Stochastics, RSI and CCI have reached the median on the weekly chart. This is as good a place as any for volatility bulls to put their foot down on the cash (15.80).
On Friday last week, VIX found support at the daily lower Bollinger band, and has since pretty much traded around the 50-day (17). Being able to recapture the average also means last week’s loss of 15-16 support was a false breakdown. As long as VIX remains above this level, it raises the odds that volatility has entered a higher plateau.
Non-commercials continue to bet on this scenario, having remained net long for six consecutive weeks. Although if past is prologue this is a time to play contrarian. Unless, of course, VIX has entered a new regime.
Thanks for reading!
