
Following futures positions of non-commercials are as of March 20, 2018.
10-year note: Currently net short 313.3k, up 41.9k.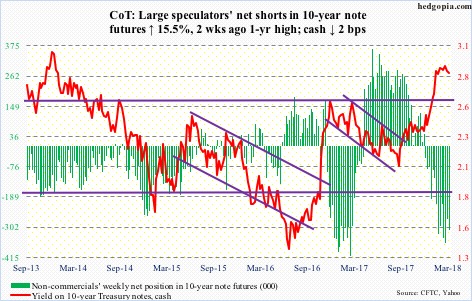
Chairing his maiden meeting as Fed chief, Jerome Powell probably could not have asked for more insofar as markets’ reaction was concerned. They did not know whether to make heads or tails of what transpired Wednesday.
On that day, the FOMC decided to hike the fed funds rate by 25 basis points to between 1.5 percent and 1.75 percent but at the same time stuck to its forecast of three hikes this year versus widespread market speculation pre-meeting that the dot plot would signal four.
Markets were not quite sure how to react to this supposed dovish hike. Except for the Russell 2000 small cap index, other major US indices fell in that session. In normal circumstances, investors/traders tend to gravitate toward small-caps when sentiment is risk-on. But then again, gold, which traditionally is a risk-off asset, rose. It is possible the yellow metal keyed off of a lower dollar. That said, the US dollar index was not able to rally on a steeper short end of the yield curve. Ten-year T-yields rallied in a long-legged doji session, but resistance held.
If these market reactions did not make sense, it was probably because they were keying off of technicals more than the Fed’s interest rate decision (more here). For instance, the S&P 500 large cap index had already fallen out of a seven-week symmetrical triangle on Monday. Come Wednesday, post-FOMC statement, it tried to rally but was rejected hard at moving-average resistance, and continued lower. Just one of those instances when technicals won out over the Fed.
30-year bond: Currently net long 52.4k, down 31.1k.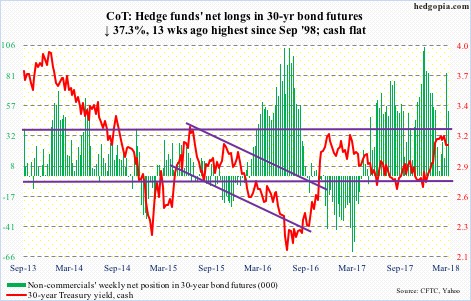
Major economic releases next week are as follows. Markets are closed Friday for observance of Good Friday.
On Tuesday, January’s S&P Corelogic Case-Shiller home price index is published. Nationally in December, home prices jumped 6.3 percent month-over-month.
Wednesday brings GDP (4Q17, final) and corporate profits (4Q17).
The second estimate showed real GDP grew 2.5 percent in 4Q17.
Corporate profits adjusted for inventory valuation and capital consumption rose 5.3 percent year-over-year in 3Q17 to a seasonally adjusted annual rate of $2.21 trillion.
Personal income and outlays (February) and University of Michigan’s consumer sentiment index (March, final) come out Thursday.
Core PCE – the Fed’s favorite measure of consumer inflation – rose 1.52 percent in the 12 months to January.
Preliminarily in March, consumer sentiment increased 2.3 points m/m to 102.
Crude oil: Currently net long 788.7k, up 30k.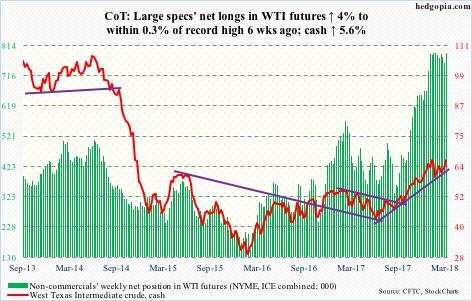
Spot West Texas Intermediate crude ($65.88/barrel) Tuesday broke out of a seven-week symmetrical triangle as well as the 50-day. It is now within spitting distance of the three-year high of $66.66 on January 25. Concurrently, the crude closed out the week right at the upper end of a six-week rising channel.
Non-commercials – stuffed to the gills with net longs – are betting on a breakout.
The EIA report for the week of March 16 – out Wednesday – helped fuel the bullish sentiment.
Crude stocks fell 2.6 million barrels to 428.3 million barrels. As did gasoline and distillate stocks – down 1.7 million barrels and two million barrels to 243.1 million barrels and 131 million barrels, respectively.
Crude imports, too, declined – down 508,000 barrels/day to 7.08 million b/d. Refinery utilization rose 1.7 percentage points to 91.7 percent.
Crude production, on the other hand, continued its upward momentum, rising 26,000 b/d to 10.41 mb/d.
E-mini S&P 500: Currently net long 83.3k, down 38.8k.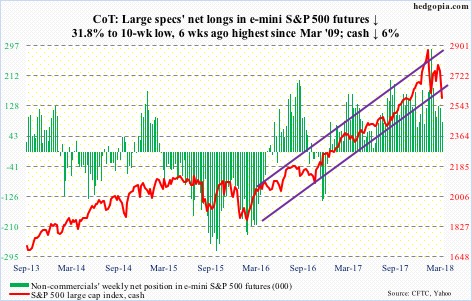
The cash (2588.26) peaked at 2872.87 on January 26 and since traded within a symmetrical triangle. Monday, it fell out of it. Bulls’ attempt to rally post-FOMC decision on Wednesday was rejected hard at a confluence of 10-, 20- and 50-day moving averages. The index closed out the week right on the 200-day (2585.22).
In the week to Wednesday, all three S&P 500-focused ETF’s lost money – SPY (SPDR S&P 500 ETF) $3.3 billion, VOO (Vanguard S&P 500 ETF) $68 million and IVV (iShares core S&P 500 ETF) $6.6 billion (courtesy of ETF.com).
In the same week, U.S.-based equity funds (including ETFs) lost $9.6 billion (courtesy of Lipper.com).
Friday, only 15.6 percent of S&P 500 stocks were above the 50-day. On February 8, the metric bottomed at 13.6 percent, and at nine percent in January 2016, so it is getting close. What happens at/near the reversal low of 2532.69 on February 9 will be a tell.
Euro: Currently net long 132.7k, down 13.6k.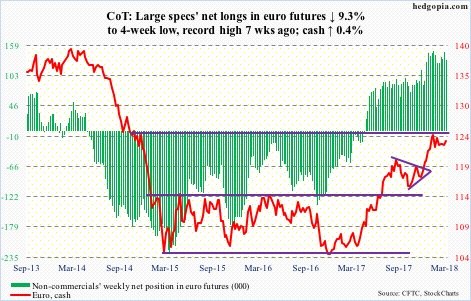
The cash ($123.57) continued to make lower highs. This has been going on since peaking at $125.37 on January 25.
Over three weeks in January and February, there were several unsuccessful attempts at $125. A falling trend line from the all-time high of $160.20 in April 2008 lies there. This level also represents measured-move-target resistance of a 10-point range breakout last July. Hence the significance of $125.
From the bulls’ perspective, the good news is that support at $122.25-ish is intact.
Gold: Currently net long 148.7k, down 19.2k.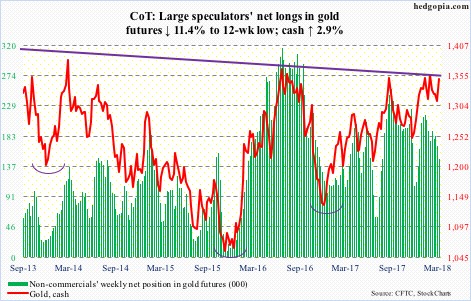
On Monday and Tuesday, the cash ($1,349.90/ounce) fell to $1,306-07 before bids showed up. The daily lower Bollinger band lied around there. Besides, support at $1,300 goes back to September 2010.
This is an opportunity for the bulls to once again go attack resistance at $1,360-70, where the metal failed twice between late January and mid-February.
Encouragingly for gold bugs, flows were very healthy in the week through Wednesday. GLD (SPDR gold ETF) took in $711 million and IAU (iShares gold trust) $223 million (courtesy of ETF.com).
Nasdaq 100 index (mini): Currently net long 12.2k, down 7k.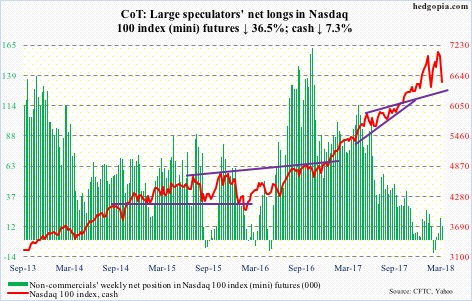
The breakout on the cash (6508.09) 11 sessions ago was fleeting. Rather tellingly, this was followed by a new high on the 13th in a bearish engulfing session. Thursday, it lost the 50-day, which is now slightly pointing down.
Both weekly and monthly momentum indicators have begun to turn lower. In a worse-case scenario for the bulls, in time they can go a lot lower. Hence the significance of flows – or a lack thereof.
In the week ended Wednesday, QQQ (PowerShares QQQ ETF) lost $1.4 billion (courtesy of ETF.com).
For now, the daily chart will soon enter oversold territory. The reversal low of 6164.43 on February 9 as well as the 200-day (6251.47) have taken on significance.
Russell 2000 mini-index: Currently net long 24.5k, up 16.9k.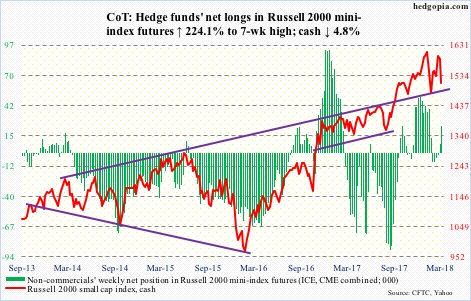
On the 13th this month, the cash (1510.08) came within 6.47 points of the all-time high of 1615.52 on January 24. Since then, it has come under pressure, losing Thursday both the 50-day and a rising trend line from February 9. The 200-day is 1.6 percent away. It will be an important test.
On a relative basis, though, small-caps are outperforming. Month-to-date, the Russell 2000 is down 0.2 percent, versus loss of 4.6 percent for the S&P 500 and 5.1 percent for the Nasdaq 100.
In the week to Wednesday, IWM (iShares Russell 2000 ETF) took in $1.5 billion and IJR (iShares core S&P small-cap ETF) $15 million (courtesy of ETF.com).
The prevailing meme is that small-caps are immune to the adverse consequences of President Trump’s imposition of tariffs because they are domestically focused. In a serious trade war, large-caps, small-caps they are all vulnerable.
US Dollar Index: Currently net short 64, down 911.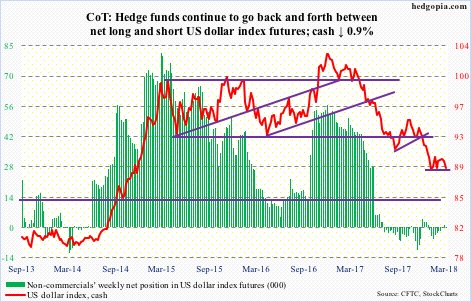
The cash (89.03) continues to get rejected at the 50-day (89.72), including Wednesday when the Fed raised interest rates. From dollar bulls’ perspective, the good thing – if it can be called that – is that the average is falling, so sooner or later it will be taken out. In this scenario, resistance lies at 90.50, and just under 91 after that. But for this to pan out, 88-89 should not give way. Non-commercials’ persistent disinterest in building net longs is beginning to raise this risk.
VIX: Currently net long 72.1k, up 18.5k.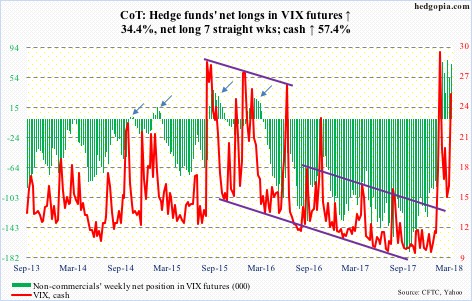
Barring a brief intraday dip below 14 on the 9th this month, support at 15-16 on the cash (24.87) has held since volatility subsided post-February 6 spike high of 50.30. The 50-day is now slightly rising.
Weekly indicators such as Stochastics, RSI and CCI have turned up from the median. There is room to rise still.
Also, the volatility curve – VXST (nine days), VIX (30 days), VXV (90 days) and VXMT (six months) – is now in backwardation, with the VXST-VXMT spread of 5.36 points. If past is prologue, this can widen to seven, eight points before beginning to unwind. Once elevated near-term volatility begins to subside, risk assets, including stocks, tend to do well. There are of course exceptions. During last month’s volatility spike, the spread surged to 34.79 on the 5th.
Thanks for reading!
