
Following futures positions of non-commercials are as of March 27, 2018.
10-year note: Currently net short 305.2k, down 8.1k.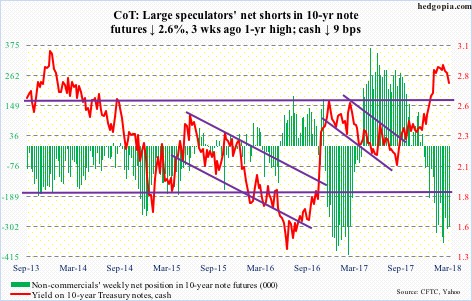
For the first time since mid-December last year, 10-year Treasury yields went under the 50-day moving average this week. On March 21 – the day the FOMC concluded its two-day meeting by raising the fed funds rate by 25 basis points – the 10-year rose intraday to 2.94 percent to match the high from February 21. We now have two back-to-back months of failure at that level.
A convincing breakout would mean the 10-year rate would finally break free of a three-decade-old descending channel. Leading into this, the majority thought the bull market in U.S. bonds was over and that the channel would soon give way. It is still intact.
In the right circumstances for bond bulls, yields can still head lower. Particularly if non-commercials are forced/tempted to reduce their massive net shorts in 10-year note futures. Yields (2.74 percent) can go test resistance-turned-support at 2.62 percent, which was taken out in January this year, after failing in December 2016 and then again in March 2017.
That said, it is a toss-up in the very near term. For five-six weeks now, 10-year yields have traded within a slightly declining channel, and are currently at the low end of it.
30-year bond: Currently net long 44.8k, down 7.7k.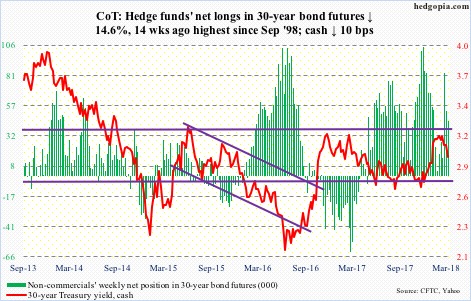
Major economic releases next week are as follows.
The ISM manufacturing index for March is published on Monday. February rose 1.7 points month-over-month to 60.8, which was the highest since 61.4 in May 2004.
Wednesday brings the ISM non-manufacturing index (March) and durable goods (February, revised).
Services activity in February came in at 59.5. January’s 59.9 was the highest ever (data only goes back to January 2008.)
The advance report for February showed orders for non-defense capital goods ex-aircraft – proxy for business capex plans – rose eight percent year-over-year to a seasonally adjusted annual rate of $67.8 billion. Orders peaked at $70.3 billion in September 2014, and have been rising since bottoming at $59.9 billion in May 2016.
On tap for Friday is March’s employment report. In February, 313,000 non-farm jobs were added. But private-sector average hourly earnings only rose 2.6 percent. The last time this metric grew with a three handle was in April 2009.
Crude oil: Currently net long 770.1k, down 18.6k.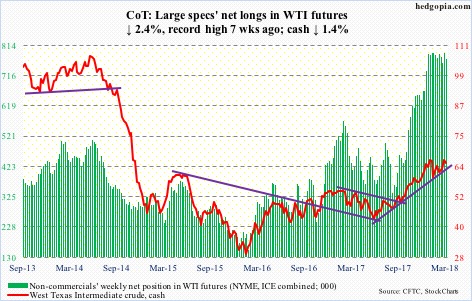
Spot West Texas Intermediate crude ($64.94/barrel) fell 1.4 percent in a holiday-shortened week, but not before testing the high from two months ago – Monday’s intraday high of $66.55 versus $66.66 on January 25. In the subsequent sessions, the 10-day moving average provided support, but the odds that the crude goes on to test the 50-day ($62.94) near term are growing.
The EIA report for the week of March 23 showed crude production, imports and stocks all rose – production up 26,000 barrels/day to 10.43 million b/d, imports up 1.1 mb/d to 8.15 mb/d and stocks up 1.6 million barrels to 429.9 million barrels.
Gasoline and distillate stocks, however, fell – down 3.5 million barrels and 2.1 million barrels to 239.6 million barrels and 129 million barrels, respectively.
Refinery utilization inched up six-tenths of a point to 92.3 percent.
E-mini S&P 500: Currently net long 226.8k, up 143.5k.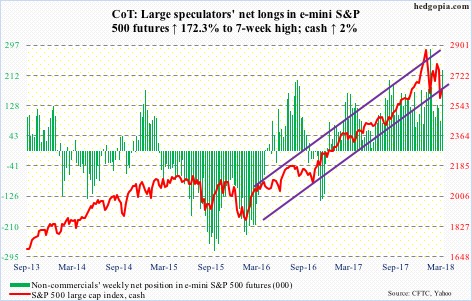
This week’s round goes to the bulls. Not only did they not lose the 200-day on the cash (2640.87) but also managed to post higher lows versus the low on February 9. Resistance lies at shorter-term moving averages, as well as the 50-day (2729.72). The path of least resistance is up near term.
On Friday last week, 15.6 percent of S&P 500 stocks were above the 50-day, slightly higher than the prior low of 13.6 percent On February 8. By Thursday this week, the metric had risen to 31.6 percent, and has room to rise.
The bulls need to see flows improve. In the week to Wednesday, there were outflows everywhere.
SPY (SPDR S&P 500 ETF) lost $5.3 billion, VOO (Vanguard S&P 500 ETF) $1.4 billion and IVV (iShares core S&P 500 ETF) $4.6 billion (courtesy of ETF.com).
In the same week, U.S.-based equity funds (including ETFs) lost $14.4 billion (courtesy of Lipper.com).
Euro: Currently net long 141.1k, up 8.3k.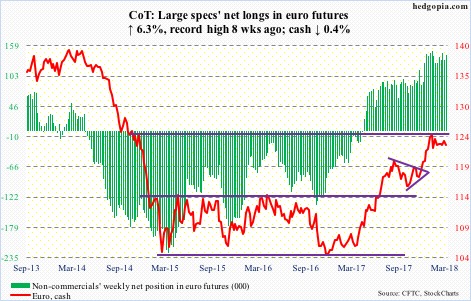
The week started off strong, with the cash ($123.04) gapping up Monday to rally past a falling trend line from January 25 when the currency peaked at $125.37. But that proved transient. By Wednesday, it had lost the 50-day, but barely.
Resistance at $125 is intact. A falling trend line from the all-time high of $160.20 in April 2008 lies there.
For the bears to get real traction, they need to push the euro below $122.25-ish.
Gold: Currently net long 203.4k, up 54.6k.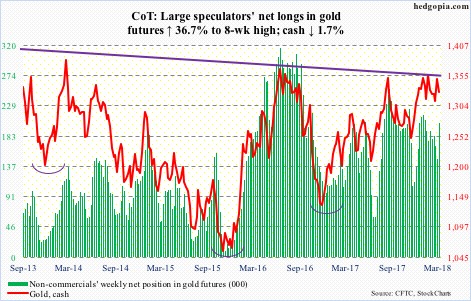
Gold bugs played cautious. After sending in a combined $933 million into GLD (SPDR gold ETF) and IAU (iShares gold trust) in the prior week, they took out $147 million in the week to Wednesday – $192 million out of GLD and $45 million into IAU (courtesy of ETF.com).
Early in the week, the cash ($1,327.30/ounce) did try to go after resistance at $1,360-70 (intraday high of $1,356.80 on Tuesday), but to no avail. The metal is now slightly under the 50-day. The daily lower Bollinger band lies just north of $1,300, where support goes back to September 2010. It is a must-hold. A rising trend line from December 2015 when gold bottomed at $1,045.40 draws to $1,250-ish.
Nasdaq 100 index (mini): Currently net long 17.6k, up 5.4k.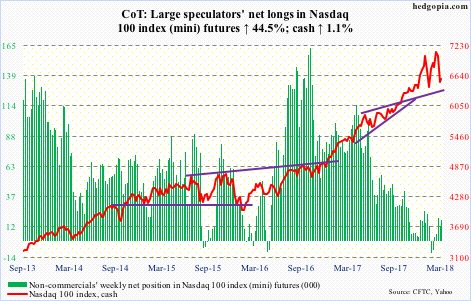
March arguably offered something for both the bulls and bears. The cash (6581.13) lost four percent in the month, but at one point in time was down 6.5 percent. That said, the bulls suffered a false breakout in the month, as well as an island reversal on the daily chart.
Near term, it increasingly looks like the bulls are putting their foot down. On the price front, this week’s low was much higher than the prior low from February 9, even as the percent of Nasdaq 100 stocks above the 50-day dropped to 17 on Wednesday, undercutting the prior low of 20 on February 8.
The risk is more medium- to long-term for the bulls. After a strong January, February produced a hanging man, followed by a reversal-like candle in March. It will take time to repair the damage that is beginning to show up on the monthly chart.
In the week ended Wednesday, QQQ (PowerShares QQQ ETF) lost $1.9 billion (courtesy of ETF.com).
Russell 2000 mini-index: Currently net long 27.1k, up 2.6k.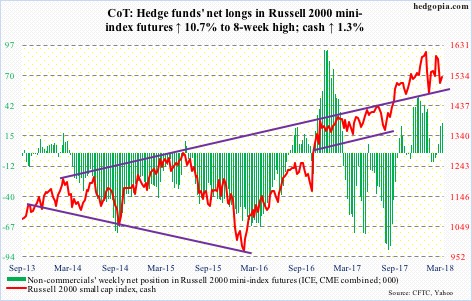
For the second week running, small-cap bulls defended support at 1515. There was a slight breach Wednesday as the cash (1529.43) dropped intraday to 1505.64 but that came in a spinning top session.
Immediate resistance lies at 1550, which already repelled rally attempts twice in the past five sessions. The 50-day (1551.50) – now falling – lies right there.
In the week to Wednesday, IWM (iShares Russell 2000 ETF) lost $705 million and IJR (iShares core S&P small-cap ETF) $66 million (courtesy of ETF.com). This follows inflows of $1.5 billion in the prior week.
US Dollar Index: Currently net short 1.8k, up 1.7k.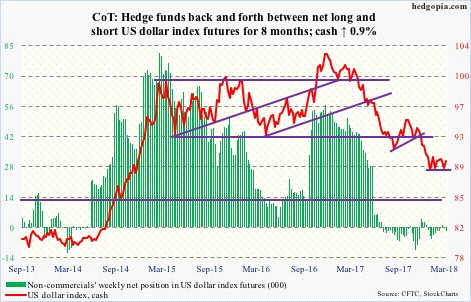
One more week in which support at 88-89, which goes back to at least 2004, was tested and held. By the end of the week, the cash (89.81) ended up above the 50-day, albeit by only 0.20. Prior to this, the average resisted rally attempts for a whole month; it is also beginning to at least go flat. All encouraging from the perspective of dollar bulls. If only non-commercials began to accumulate net longs.
Resistance lies at 90.50, and after that just under 91.
VIX: Currently net long 74.7k, up 2.7k.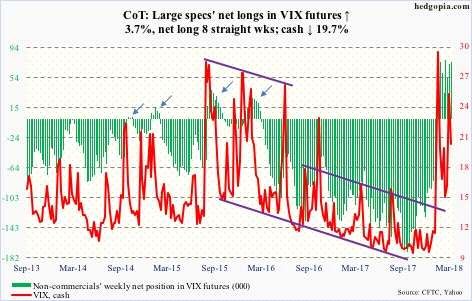
After a massive spike reversal in February, the cash (19.97) produced a long-legged doji in March. This is a candle showing indecision.
Post-February 6 reversal (from an intraday high of 50.30) and the subsequent drop, March in particular witnessed resistance at 26. At the same time, from volatility bulls’ perspective, barring a brief intraday drop below 14 early March, support at 15-16 held.
This week, VIX began retreating from the daily upper Bollinger band. The 50-day (18.96) is a stone’s throw away. The lower Bollinger band lies at 13.35, just above the 200-day at 12.68.
Near term, VIX can come under pressure.
Thanks for reading!
