
Following futures positions of non-commercials are as of April 17, 2018.
10-year note: Currently net short 371.7k, up 41.1k.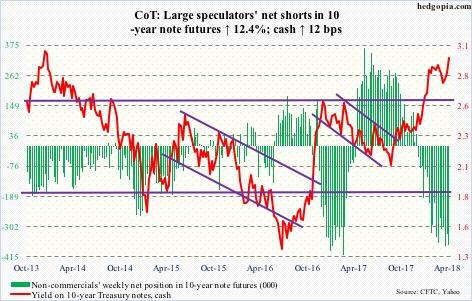
The Treasury yield curve once again is the talk of the town.
The yield spread between 10- and two-year notes fell to 41 basis points Tuesday. This was the lowest since October 2007. It closed the week at 50 basis points.
Two-year yields (2.46 percent) – seen as a proxy for monetary policy expectations – continue to rise, even as the 10-year rate (2.95 percent) remains bound by resistance at three percent.
As early as February 9, the spread was 78 basis points. At this rate, inversion is not far away. An inverted yield curve historically has preceded many of the US recessions.
Back in 2000, the curve went negative in February 2000, reaching minus 52 basis points in April that year. Recession began in March 2001.
Then in December 2005, the curve again went negative, reaching minus 16 basis points in February 2006. After briefly turning positive, it once again turned negative in June that year. By November, the spread was minus 19 basis points. Great Recession began in December 2007.
Markets’ preoccupation with inversion is understandable. With that said, a couple of points are worth noting.
First, post-financial crisis, both the short and long end of the curve remains manipulated. The economy is nearly nine years into recovery, and the fed funds rate is still sub-two percent – was raised by 25 basis points last month to a range of 150 to 175 basis points. On the long end, the Fed’s SOMA holdings include $2.28 trillion in Treasury notes and bonds, up from just north of $400 billion pre-crisis. This put downward pressure on long yields.
Second, because of this very fact, the historical relationship between inversion and recession may or may not work this time around. Do we absolutely have to have the former for the latter to occur? No one knows. The post-Great Recession recovery has broken many an established record.
30-year bond: Currently net long 45.3k, up 10.4k.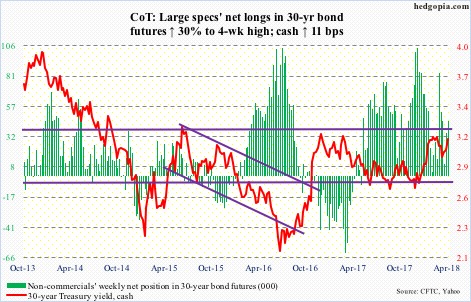
Major economic releases next week are as follows.
March’s existing home sales are due out Monday. February was up three percent month-over-month to a seasonally adjusted annual rate of 5.54 million units. Last November’s 5.72 million was the highest since 5.79 million in February 2007.
The S&P Corelogic Case-Shiller home price index (February) and new home sales (March) come out Tuesday.
Nationally, home prices rose 6.2 percent year-over-year in January. This was the 69th consecutive month of price increase.
New home sales in February fell 0.6 percent m/m to 618,000 units (SAAR). Last November’s 711,000 was the highest since 727,000 in October 2007.
Thursday brings durable goods orders for March. Orders for non-defense capital goods ex-aircraft – proxy for business capex plans – rose 7.7 percent y/y in February to $67.7 billion (SAAR). Orders peaked at $70.3 billion in September 2014.
On Friday, GDP (1Q18, advance), employment cost index (1Q18) and University of Michigan’s consumer sentiment index (April, final) are published.
As of Tuesday, the Atlanta Fed’s GDPNow model was forecasting 1Q18 growth of two percent. The last three quarters of 2017 were strong, having grown 2.9 percent in 4Q, and 3.2 percent and 3.1 percent before that.
Private-sector comp rose 2.6 percent for the 12 months through December 2017. This was the fastest growth rate in 11 quarters.
Preliminarily, April’s consumer sentiment fell 3.6 points m/m to 97.8. March’s 101.4 was the highest since 103.8 in January 2004.
Crude oil: Currently net long 769k, up 26.8k.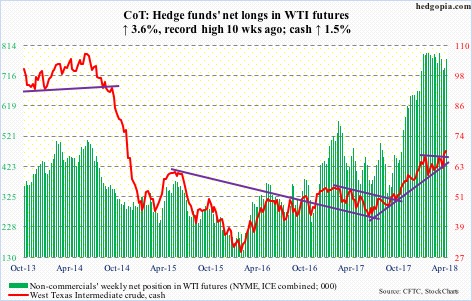
After successfully retesting last week’s breakout, spot West Texas Intermediate crude ($68.40/barrel) rallied further along the rising daily upper Bollinger band this week. The 10-day moving average was defended Tuesday. Come Wednesday, the crude rallied 2.9 percent.
The EIA report for the week of April 13 – out Wednesday – helped.
Stocks of crude, gasoline and distillates all fell – down 1.1 million barrels, three million barrels and 3.1 million barrels, respectively, to 427.6 million barrels, 236 million barrels and 125.3 million barrels.
Ditto with crude imports, which declined 720,000 barrels/day to 7.93 million b/d.
Crude production, however, continued to rise, up 15,000 b/d to 10.54 mb/d.
Refinery utilization fell 1.1 percentage points to 92.4 percent.
Thursday, spot WTI rallied to $69.55 intraday, but closed the session with a potentially reversal candle with a topping tail. Resistance around that level goes back to September 2005. It will be interesting to see how things evolve when breakout retest occurs at $66.50-ish.
E-mini S&P 500: Currently net long 212.3k, up 2.7k.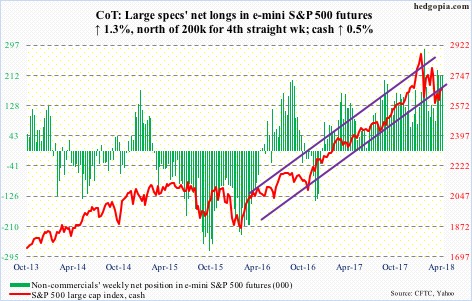
The cash (2670.14), having rallied to 2717.49 Thursday, came very close to testing a falling trend line from January 26 when it peaked at 2872.87. It was an unsuccessful test. If the daily chart prevails, it will remain that way. At least near term, the path of least resistance is down. The week produced a gravestone doji.
If this scenario pans out, it will be interesting to see how flows respond. In the week to Wednesday, US-based equity funds (including ETFs) took in $4.6 billion (courtesy of Lipper.com).
In the same week, $309 million moved into SPY (SPDR S&P 500 ETF) and $304 million into VOO (Vanguard S&P 500 ETF), while IVV (iShares core S&P 500 ETF) lost $239 million (courtesy of ETF.com).
In the meantime, foreigners’ 12-month purchases of US stocks peaked in January, as did the S&P 500.
Euro: Currently net long 151.5k, up 4k.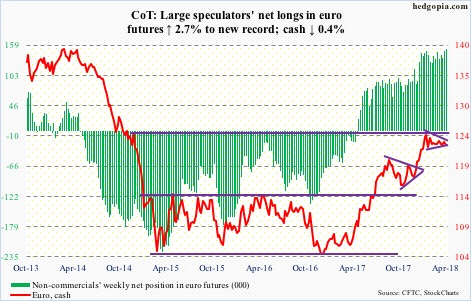
The status quo continues.
The cash ($122.93) remains underneath a falling trend line from the all-time high of $160.20 in April 2008, which lies around $125. At the same time, support at $122-122.50 is intact. Friday, the euro dipped to $122.50 intraday before bids showed up.
In this context, depending on how one draws it, a descending and/or a symmetrical triangle has formed on the cash. Whichever way it breaks likely carries the momentum. Non-commercials, with record longs, are betting this will be to the upside, but this could equally be a case of a crowded long.
Gold: Currently net long 163.1k, up 7.7k.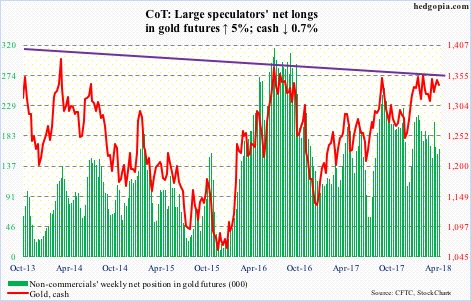
Flow trends continue to be positive. In the week through Wednesday, GLD (SPDR gold ETF) attracted $256 million and IAU (iShares gold trust) $163 million (courtesy of ETF.com). In the past five (beginning the week ended March 21), inflows have totaled $1.4 billion and $818 million, in that order.
On March 20, the cash ($1,338.30/ounce) bottomed at $1,306.60, which at the time approximated the daily lower Bollinger band, before proceeding to rally to test resistance at $1,360-70, which is yet to give way. From gold bugs’ perspective, this is a little discouraging, in that the inflows into these ETF’s were sufficient to push the metal to resistance, but not through it.
The 50-day is $5 away.
Nasdaq 100 index (mini): Currently net short 7.9k, up 1.2k.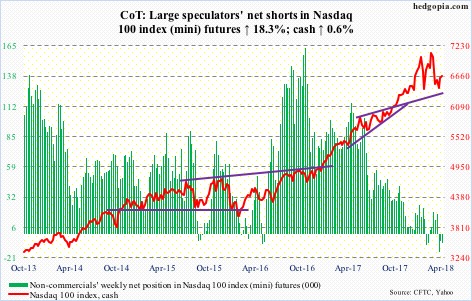
The cash (6667.75) enjoyed a back-to-back positive week, but not before giving out signs of fatigue. Wednesday produced a spinning top, with the session high kissing the daily upper Bollinger band.
In the week ended that session, QQQ (PowerShares QQQ ETF) pulled in another $1.9 billion. In the prior week, $197 million came in (courtesy of ETF.com). All positive, except the Nasdaq 100 may need to digest recent gains.
Friday, it sliced through the 50-day. This also approximates trend-line support from nearly three weeks ago.
Russell 2000 mini-index: Currently net long 15.8k, up 5.1k.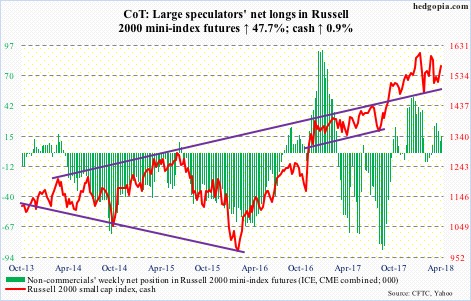
In a shooting star session Wednesday, the cash (1564.12) got rejected at a falling trend line from the all-time high of 1615.52 on January 24. It has had a nice rally since bottoming at 1482.90 on the 2nd this month – with full cooperation from flows in the past couple of weeks.
In the week to Wednesday, $789 million moved into IWM (iShares Russell 2000 ETF) and $417 million into IJR (iShares core S&P small-cap ETF). This was preceded by inflows of $868 million and $248 million, respectively, in the prior week (courtesy of ETF.com).
The daily chart is overbought, and is itching to go lower. The 50-day lies at 1543.09.
US Dollar Index: Currently net short 2.4k, up 610.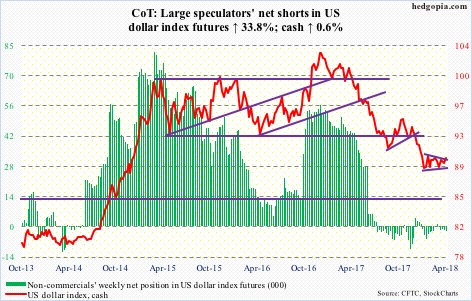
One more week of sideways congestion inside a symmetrical triangle. This more often than not is a continuation pattern. The cash (90.07) has gone sideways the past three months after coming under sustained pressure beginning January 2017.
There is major support at 88-89, which goes back to at least 2004, and this once again held early this week. Friday, the US dollar index rallied past the 50-day – now slightly rising – into the daily upper Bollinger band. Short-term resistance lies at 90.30-ish.
VIX: Currently net long 78k, down 15k.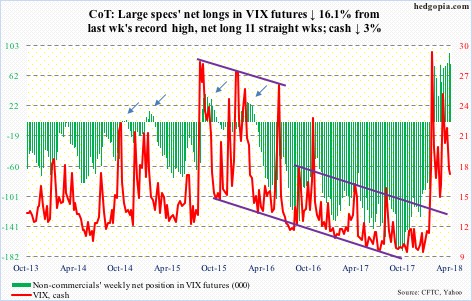
Several weekly momentum indicators on the cash (16.88) have reached the median. This is as good a place as any for volatility bulls to put their foot down.
Tuesday, VIX went sub-15 intraday to test the daily lower Bollinger band before closing above. Support at 15-16 is intact.
There is room for continued unwinding of the daily oversold conditions.
Thanks for reading!
