Following futures positions of non-commercials are as of July 3, 2018.
10-year note: Currently net short 500.1k, up 144.8k.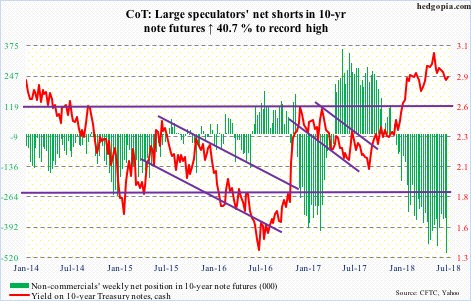
Minutes for the June 12-13 FOMC meeting were released last Thursday. The Fed raised interest rates in that meeting. This was the second 25-basis-point hike this year, the other being in March. The June dot plot also signaled two more hikes to come this year. In the March meeting, members expected three. “With the economy already very strong and inflation expected to run at 2 percent on a sustained basis over the medium term,” the tightening bias has tilted more hawkish. Particularly so as “the stance of monetary policy remained accommodative.”
After keeping the fed funds rate near zero for seven long years, the Fed began raising in December 2015. Rates are currently between 175 and 200 basis points. Two more hikes this year would put the fed funds rate at 225-250 basis points. Thus far, markets are convinced of a hike in September (25-26), but not as sure about December (18-19). Pre-minutes, September odds were 80 percent, while December was at 53 percent. Monday, they were 84 percent and 58 percent, in that order. If the economy evolved as expected by the Fed, they plan to hike three more times next year.
Arguably, the Fed wants to build as big a cushion as possible for the next downturn, whenever that is. The problem is that in this scenario the yield curve (10s/2s) will invert. Last Thursday, the spread shrank to a mere 29 basis points – the lowest since August 2007. Ten-year Treasury yields (2.86 percent) continue to look at the dot plot with a cautionary eye. Non-commercials have record net shorts in 10-year note futures. A squeeze is possible in due course, putting these yields under further pressure.
30-year bond: Currently net short 15.8k, up 5.8k.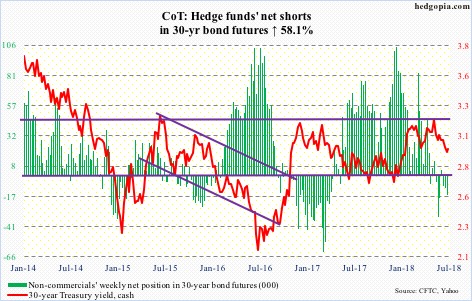
Major economic releases this week are as follows.
On Tuesday, the NFIB small business index (June) and JOLTS (May) are on deck.
Small-business optimism rose three points month-over-month in May to 107.8. This was the second highest reading in its 45-year history.
Non-farm job openings in April increased 65,000 m/m to 6.7 million, a new record.
June’s PPI is scheduled for Wednesday. Producer prices rose 0.5 percent m/m in May and 3.1 percent in the 12 months through May. Over the same time period, core PPI increased 0.1 percent and 2.6 percent respectively.
Thursday brings consumer inflation for June. In May, both CPI and core CPI nudged higher 0.2 percent m/m. In the 12 months to May, they respectively rose 2.8 and 2.2 percent.
Friday has University of Michigan’s consumer sentiment index for July on tap. Consumer sentiment in June inched up two-tenths of a point m/m to 98.2. March’s 101.4 was the highest since January 2004.
Crude oil: Currently net long 704.5k, up 26.5k.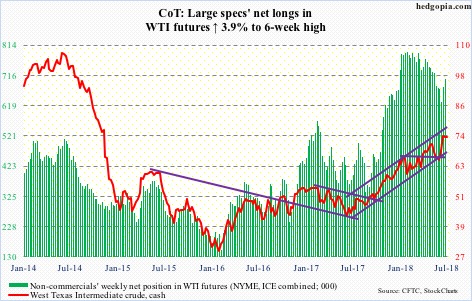
Spot West Texas Intermediate crude ($73.85/barrel) has traded within an ascending channel for just over a year. The upper bound gets tested around $76. Tuesday last week, in a long-legged doji session, it rallied to $75.27 before retreating. The daily chart is itching to go lower. After two solid weeks, last week produced a weekly spinning top. Immediate support lies at $72.50-ish, and after that $69-69.50.
The EIA report for the week of June 29 showed crude stocks rose 1.2 million barrels to 417.9 million barrels. Distillate stocks increased as well, up 134,000 barrels to 117.6 million barrels. Ditto with crude imports, which jumped 699,000 barrels/day to 9.06 million b/d – the highest since mid-September 2012. Crude production remained flat at 10.9 mb/d – flat for four weeks.
In the meantime, refinery utilization nudged lower four-tenths of a percentage point to 97.1 percent. The prior week was a 13-year high. Gasoline stocks fell 1.5 million barrels to 239.7 million barrels.
E-mini S&P 500: Currently net long 168k, down 29.2k.
Two weeks ago, bulls just about defended a rising trend line from February 2016. Last week, they continued to defend the 50-day moving average. The cash (2784.17) has room to squeak higher still near term. Particularly so if the prevailing trend in fund flows reverses and 2800 is taken out.
US-based equity funds (including ETFs) lost another $8.3 billion in the week to Wednesday last week (courtesy of Lipper.com). In the prior four, $35.3 billion came out. In all of last week, SPY (SPDR S&P 500 ETF) lost $1.9 billion and VOO (Vanguard S&P 500 ETF) $92 million, even as IVV (iShares core S&P 500 ETF) gained $464 million (courtesy of ETF.com).
Bulls would also want to see money-market funds continue to contract and that at least some of it find a home in equities. In the week through last Tuesday, these funds held $2.82 trillion, down from $2.88 trillion four weeks ago (courtesy of ICI).
Euro: Currently net long 36.7k, up 2.8k.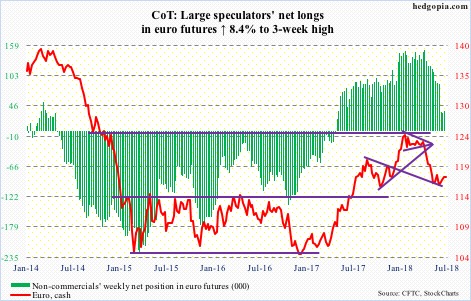
Last week’s 0.5-percent rally on the cash ($117.52) was preceded by a couple of back-to-back weekly hammers. In both those weeks, $114-115 drew bids. After going sideways in a rectangle for nearly two and a half years, the euro broke out of this level last July. It subsequently rallied to $125.37 in January this year, where it got repelled by a falling trend line from April 2008.
Shorter-term moving averages are beginning to turn up. As long as the aforementioned support holds, it is the bulls’ ball to lose.
Gold: Currently net long 78.3k, up 1.7k.
One more week in which gold-focused ETFs bled, with GLD (SPDR gold ETF) last week losing $675 million and IAU (iShares gold trust) $96 million (courtesy of ETF.com). If there is a silver lining in this cloud it is that the cash ($1,259.60/ounce) once again absorbed this well. The metal inched higher 0.1 percent last week.
Last Tuesday, gold dropped to $1,238.80 intraday before reversing higher. The reversal successfully defended a rising trend line from December 2015, when gold bottomed at $1,045.40. Since then, the trend has been higher, although rally attempts have persistently been rejected at $1,360-70. Nearest resistance lies at $1,280-ish, followed by $1,300-plus.
Nasdaq 100 index (mini): Currently net long 16.2k, up 2.6k.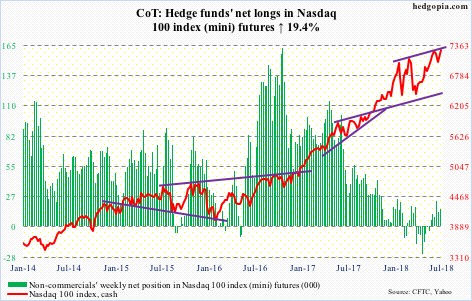
Bids showed up at/near the 50-day for several sessions before the cash (7276) lifted off of the average. A couple of weeks ago, the Nasdaq 100 was repelled at the upper bound of a four-and-a-half-month-old ascending channel. Now, it is within striking distance of its all-time high of 7309.99 from June 20. Volume could be better. This is also true with the flows. QQQ (PowerShares QQQ ETF) last week lost $674 million (courtesy of ETF.com).
Russell 2000 mini-index: Currently net long 50.7k, down 11.4k.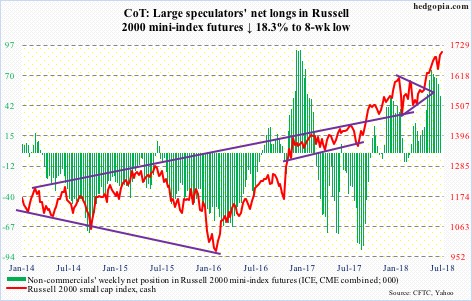
Once again, the 50-day was tested on the cash (1704.60). Monday’s (last week) intraday low of 1631.06 arguably was a successful retest of the mid-May break out of 1610-15. The June 20 all-time high of 1708.10 is a stone’s throw away.
Rightly or wrongly, small-caps have been a beneficiary of investor perception that they do not get hurt in a trade war as large-caps would. With trade tensions between the US and China in particular rising, it will be telling how these stocks perform going forward.
Last week, IWM (iShares Russell 2000 ETF) attracted $331 million and IJR (iShares core S&P small-cap ETF) $233 million (courtesy of ETF.com).
US Dollar Index: Currently net long 18.7k, up 446.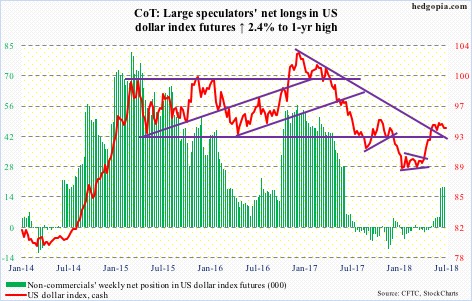
The cash (93.81) faced resistance at 95 for a whole month before retreating from an intraday high of 95.25 seven sessions ago. The pullback is occurring at a crucial juncture.
The US dollar index reached an intraday high of 103.82 on January 3. Between that high and an intraday low of 88.15 on February 16, it fell 15.1 percent. A 38.2-percent retracement of this decline lies at 94.14 (more here). Below 94, near-term scales swing in favor of dollar bears, with the 50-day at 93.63. If the weekly chart prevails, there is plenty of room for continued unwinding of overbought conditions medium term.
VIX: Currently net short 33.2k, down 16.6k.
Since a mini-spike reversal from 10 sessions ago when the cash (12.69) jumped to an intraday high of 19.61, volatility has subsided. The 50- and 200-day have converged. VIX stayed above the averages for eight straight sessions before losing them last Friday.
When VIX made that spike, the VIX-to-VXV ratio rose as high as 1.03 – elevated enough to begin to unwind, which has occurred. Last week, the ratio closed at .851. There is room for this to continue to shrink. When this happens, premium comes out of VIX faster than VXV. This bodes well for equities.
Medium term, however, the 21-day moving average of the CBOE equity-only put-to-call ratio needs to unwind the optimism it reflects. On June 26, it fell to as low as .56. Monday (this week), it stood at .581. In ideal circumstances, this can rise to high-.60s/low-.70s. When this occurs, equities tend to come under pressure.
Thanks for reading!

