Following futures positions of non-commercials are as of October 2, 2018.
10-year note: Currently net short 740.2k, down 16.1k.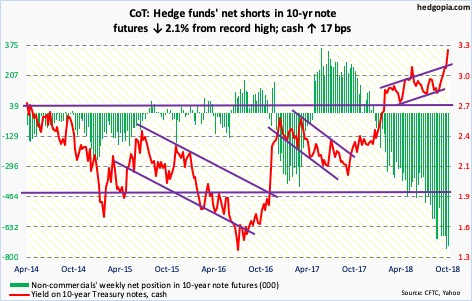
Kudos to non-commercials for having doggedly remained bearish on 10-year Treasury notes. They reaped a bumper crop this week. In September last year, the 10-year rate (3.23 percent) began to rise from 2.03 percent. These traders have since been amply rewarded. Yields have remained north of three percent the past three weeks. This week, the 10-year rate broke past the mid-May high of 3.12 percent, rallying 17 basis points.
The last time the 10-year unsuccessfully tried to take out three-plus percent was five years ago. This was then followed by an all-time low of 1.34 percent in July 2016. Then in April this year, it again went after that resistance – unsuccessfully, but at the same time it kept hammering on it in the following weeks and months. Until it gave way this week.
In all probability, stops got taken out this week, which added fuel to the fire. How high can these yields go? Here is a hint. There are plenty of fundamental reasons to argue for higher yields – ranging from rising US budget deficit to the Fed reducing its Treasury holdings to lesser foreign demand. But at the same time, post-financial crisis, leverage has only grown. The US economy’s sensitivity to interest rates has only grown. Potential higher interest payments thus should act as natural brakes on long yields, including the 10-year. It is just that bids are likely to show up at a higher level than in recent past.
30-year bond: Currently net short 119.8k, up 16.8k.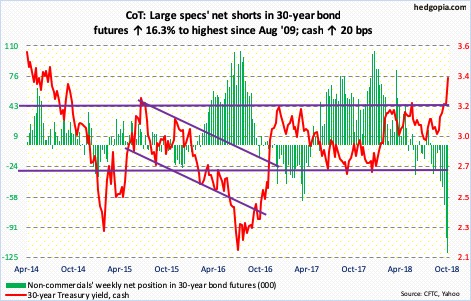
Major economic releases next week are as follows.
The NFIB small business optimism index for September comes out Tuesday. In August, it rose nine-tenths of a point month-over-month to 108.8, a new record.
September’s producer prices are scheduled for Wednesday. PPI slipped 0.1 percent m/m in August. In the 12 months to August, it rose 2.8 percent. In the same time period, core PPI rose 0.1 percent and 2.9 percent, respectively.
Thursday brings CPI for September. August consumer prices increased 0.2 percent m/m and 2.7 percent in the 12 months through August. Core CPI rose 0.1 percent m/m in August and 2.2 percent in the 12 months ended August.
October’s preliminary reading of University of Michigan’s consumer sentiment index is on tap for Friday. Sentiment jumped 3.9 points m/m in September to 100.1, near March’s 101.4, which was the highest since January 2004.
Crude oil: Currently net long 596.8k, down 9.8k.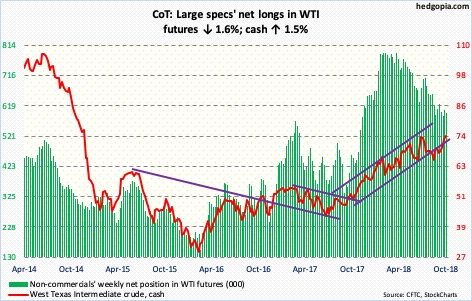
Shortly after rallying past short-term resistance at $71-plus Monday last week, spot West Texas Intermediate crude ($74.34/barrel) kept rallying, taking out the prior high from three months ago, to Thursday’s intraday high of $76.90. Conceivably, it is a false breakout. Time will tell. The weekly produced a huge shooting star. Particularly on the daily chart, there is room for the crude to continue lower.
In the week ended September 28, after staying sub-400 million for three weeks, US crude stocks rose eight million barrels to 404 million barrels. Crude imports increased 163,000 barrels per day to eight million b/d. Crude production remained unchanged at 11.1 mb/d. Refinery utilization was unchanged as well, at 90.4 percent. Gasoline stocks, however, fell 459,000 barrels to 235.2 million barrels. Distillate stocks dropped 1.8 million barrels to 136.1 million barrels.
E-mini S&P 500: Currently net long 228k, up 30.1k.
In the week to Wednesday, US-based equity funds (including ETF’s) took in $1.5 billion (courtesy of Lipper.com). In the same week, $1.8 billion moved into SPY (SPDR S&P 500 ETF), while IVV (iShares core S&P 500 ETF) attracted $660 million; VOO (Vanguard S&P 500 ETF) lost $43 million (courtesy of ETF.com).
These inflows came in just before the shellacking in the last two sessions of the week. The cash (2885.57) shed 0.8 percent Thursday and 0.6 percent Friday. There were bids waiting at/near 2870s (January high). Friday, the 50-day moving average (2877.14) was breached intraday but saved by close.
Thursday’s drop preceded some signs of distribution. For six sessions, the S&P 500 tried to rally but was unable to hang on to all of the gains, resulting in long upper shadows. Monday was a spinning top and Tuesday a doji. For a while now, the rally was led by the generals, while the soldiers kept losing ground (more on this here). Friday, only 49.2 percent of S&P 500 stocks were above their 50-day; this metric is getting oversold on the daily.
The weekly remains grossly overbought. If the 50-day is lost, 2850 is another level worth watching. A rising trend line from early April extends there. Then there is 2800.
Euro: Currently net short 7.1k, up 10.8k.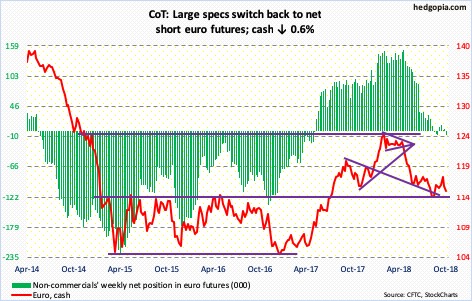
Since getting rejected Monday last week at just north of $118, it was all downhill for the cash ($115.29). The underside of a broken trend line from early 2017 persistently repelled rally attempts. Wednesday, support at $115-plus was slightly breached as the currency fell to $114.65 intraday. Support at $115-plus goes back four years. In due course, euro bulls face a breakdown risk. Some of the weekly momentum indicators have turned lower. Mid-August, the euro fell to an intraday low of $113.01.
Gold: Currently net short 21.8k, up 4.2k.
Once again, broken-support-turned-resistance at $1,213-ish came in the way. Tuesday and Wednesday, the cash ($1,205.60/ounce) rallied to north of $1,212 and Thursday north of $1,210, but was not able to break past that resistance. This is also where the 50-day ($1,206.49) lies.
That said, support at $1,180s, which goes back nine years, was defended last week. The weekly MACD continues to work on a potentially bullish crossover. The metal has gone sideways for nearly two months now.
Interestingly this week, gold held its ground even though in the week through Wednesday GLD (SPDR gold ETF) suffered $408 million in outflows. In the prior 21 weeks, the ETF lost $5.1 billion, with only one week of positive flows. In the week to Wednesday, IAU (iShares gold trust) gained $50 million (courtesy of ETF.com).
Nasdaq 100 index (mini): Currently net long 36.2k, down 64.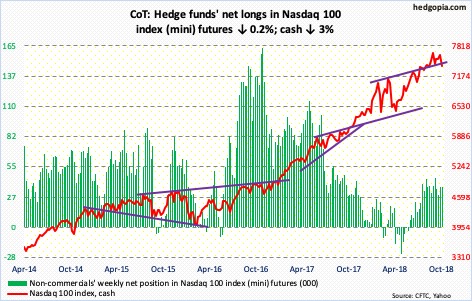
In September, bulls defended the 50-day on the cash (7399.01) for 13 sessions. The subsequent liftoff was anything but convincing. Monday’s intraday record high of 7700.56 edged past the prior high from August 30, but only to stall. Thursday, the Nasdaq 100 dropped 1.9 percent, and another 1.2 percent Friday. Prior to this, the soldiers had been lagging for a while, with the generals doing all the heavy lifting. Medium- to long-term, this is not a healthy combo.
If the weekly chart takes over, there is a long way to go on the downside. The 50-day was lost Friday. Immediately ahead, there is support at 7300, which was successfully tested Friday. This is where a rising trend line from early April lies.
In the week ended Wednesday, QQQ (Invesco QQQ Trust) lost $617 million (courtesy of ETF.com).
Russell 2000 mini-index: Currently net short 37.9k, up 20k.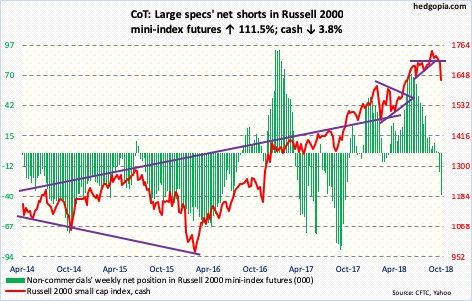
Monday, the cash (1632.11) tried to recapture the 50-day, which was lost last week, but to no avail. Sellers/shorts quickly showed up. At least until Wednesday, flows into IWM (iShares Russell 2000 ETF) and IJR (iShares core S&P small-cap ETF) were positive, with inflows of $874 million and $42 million respectively (courtesy of ETF.com), but this was nothing in front of the selling that followed. The Russell 2000 dropped 3.8 percent for the week.
The daily is grossly oversold. Should a rally ensue, there is plenty of overhead resistance for shorts to reappear. For now, the 200-day (1618.99) was defended Friday. This level also approximates retest of mid-May breakout at 1610-ish. Plus, this is where a rising trend line from February 2016 rests. A must-save for small-cap bulls.
US Dollar Index: Currently net long 37k, up 27.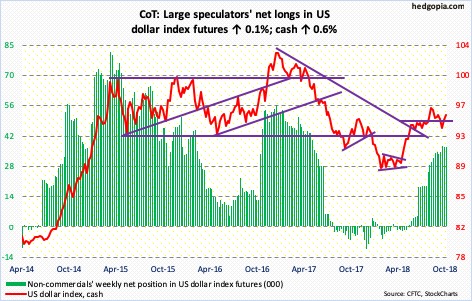
Post-defense two weeks ago of support at 93.30-ish, the cash (95.31) quickly rallied to the daily upper Bollinger band. In doing so, it also recaptured the 50-day (94.97) as well as 95-plus. The latter is an important level, and could get tested again. The daily chart is beginning to get overbought.
VIX: Currently net short 140.4k, up 669.
After a long-legged doji on Monday and a spinning top on Wednesday, VIX (14.82) Thursday shot up 22.5 percent, and another 4.2 percent Friday. In fact, intraday Friday it was up another 22.1 percent to 17.36, a three-month high. Both Thursday and Friday, it closed above the 200-day intraday, but was unable to close above. Friday’s could very well be a reversal high near term. That said, in the medium term, there is now a potentially bullish MACD crossover.
Concurrently, the 21-day moving average of the CBOE equity-only put-to-call ratio has risen since 0.588 on September 25. Friday, it closed at 0.602. This is still a suppressed reading. If past is prologue, the ratio can rally to high-0.60s to low-0.70s before elevated investor optimism gets unwound.
Thanks for reading!

