The following are futures positions of non-commercials as of May 5, 2015. Change is week-over-week.
10-year note: It was a weird week. That is an understatement. Up until Wednesday, 10-year yields were up 20 basis points. Treasurys on the long end were getting “routed.” Come Thursday, bids started coming in. Even Friday’s supposedly “good” jobs report was not enough to motivate sellers. In the end, the 10-year essentially treaded water for the week.
The real rout was taking place somewhere else. German 10-year bunds were yielding 0.05 percent just two weeks ago, now they are at 0.54 percent. These bonds were yielding 40 basis points when eurozone QE began. Mr. Draghi is probably not thrilled.
Having said that, investor reaction to eurozone QE is not without precedent. Leading up to all three iterations of QE in the U.S. (November 2008, November 2010, and September 2012), long rates fell and then rose as QE got underway. Simple front-running. Or buy the rumor, sell the news.
Interestingly, non-commercials raised net shorts to a 17-week high. Their holdings are as of Tuesday, and by then the yield had risen for seven consecutive sessions. Probably got carried away, and may very well be setting up for a squeeze.
Currently net short 183.1k, up 84.6k.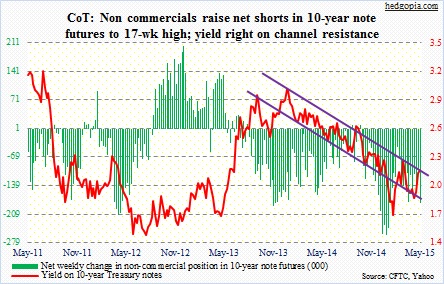
30-year bond: Despite the selling that was going on in bonds, TLT was beginning to attract bids as early as Tuesday, as it produced a hammer near its 200-day moving average, where it closed out the week. This thing looks constructively positioned to move higher; 122 support is key, and 127 gap resistance lies ahead. As a corollary, the 30-year yield found support at its 200-day moving average, but remains way overbought on a daily basis.
The one data point that can throw a monkey wrench into this scenario is retail sales for April that comes out on Wednesday. This series has had a rough go of it in recent months. Four out of the past seven months, sales shrank month-over-month (March was up 0.9 percent). Year-over-year growth decelerated to 1.3 percent in March from five percent last August.
NFIB small business optimism index and JOLTS are on Tuesday. The latter only goes back to 2004, but job openings have tended to lead non-farm payroll. February saw an all-time high of 5.1 million openings; in contrast, quits weakened to 2.7 million, so needs a close watch.
Industrial production is on Friday. Capacity utilization posted a cycle high 79.5 last December, and has since dropped to 78.4 (March). This kind of jibes with what is going on in the global economy. In China, both foreign and domestic demand has softened going into 2Q. In April, both exports and imports fell 6.4 percent and 16.2 percent, respectively; they were also down 15 percent and 12.7 percent in March.
Currently net long 11k, up 7.5k.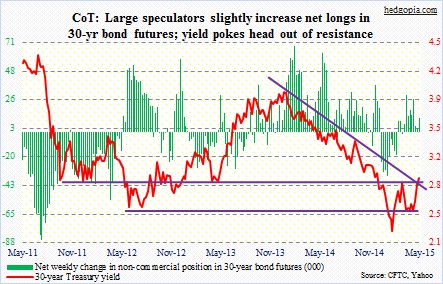
Crude oil: The EIA reported that U.S. crude stocks fell last week for the first time since the week ended January 2; inventories dropped by 3.88 million barrels. At one point, spot West Texas Intermediate crude was up nearly $3 for the week, but gave it all away.
The shooting star on Wednesday (now on a weekly chart as well) is probably a strong signal that we have a top in oil – near-term probable, intermediate-term possible. EOG, by the way, made it very clear that it plans to return to double-digit production growth should the WTI reach $65 or higher. It is an automatic price cap, come to think of it.
On Friday, support at 58 was successfully tested. But a bigger test probably lies ahead; 54 is a must-hold.
This tidbit from an April 10th Fitch Ratings survey of 75 senior investors: Sixty one percent of respondents said high-yield bonds are modestly or strongly overvalued. Fitch also said credit conditions are worsening in the energy sector, which is 18 percent of high-yield bonds. The energy default rate is rising – 0.9 percent at end-March.
Currently net long 348.1k, up 4.5k.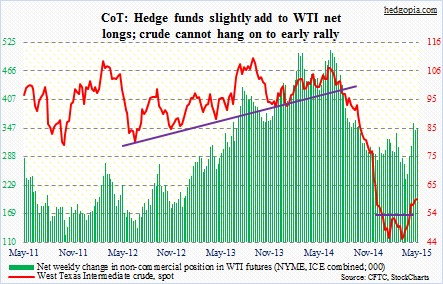
E-mini S&P 500: Did buybacks begin in earnest already? You wonder! In the first three sessions this week, the S&P 500 large cap index was down nearly two percent. By Friday, it was all recouped, and then some. FactSet points out that $13 billion came out of SPY in April. So corporations better keep their buyback machine humming along.
Even Janet Yellen, Federal Reserve chair, is beginning to talk about valuations! Not that multiples are crazy high, but they are above average. In a panel discussion on Wednesday, she opined: “I guess I would highlight that equity valuations at this point generally are quite high. They are not so high when you compare the returns on equities to the returns on safe assets like bonds, which are also very low but there are potential dangers there.” Equities give her the cold shoulder. Ah, well! So much for ‘don’t fight the Fed’.
There was whipsaw action all week. It is possible non-commercials became a victim themselves. The index dropped 1.2 percent on Tuesday, which perhaps led them to increase net shorts – by 129 percent in the reporting week. They probably got squeezed on Friday.
Currently net short 79.3k, up 44.7k.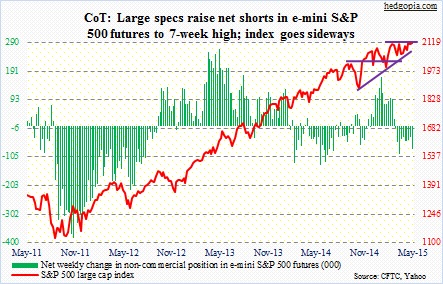
Euro: In keeping with whipsaw actions in various other assets this week, the currency has had its share. Until the Wednesday intra-day high, the euro was up 1.6 percent for the week, but gave it all back by the end of the week.
Not surprising perhaps given that from trough to peak in seven weeks the currency rallied nearly nine percent. Along the way, some good news came along. The European Commission now expects the euro area economy to grow 1.5 percent this year, up from previous forecast of 1.3 percent.
Nonetheless, it is probably time for a breather. On a weekly basis, oversold conditions still have unwinding left to do. But daily conditions are now way overbought, and look ready to want to go lower. The 50-day moving average lies at 108.74.
From end-March highs, non-commercials have reduced net shorts by 16 percent.
Currently net short 190.1k, down 7.6k.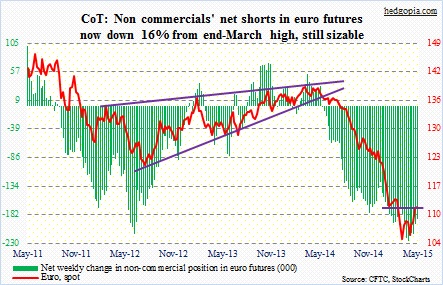
Gold: The sideways move in the metal is probably beginning to get on these traders’ nerves. They reduced net longs by 28 percent, which are now down substantially from end-January highs. Gold cannot get going.
If there is any comfort in this sideways action, it is this. Moving averages are consolidating as well. Several of them, particularly short-term, are no longer pointing down. Bollinger bands are narrowing as well. A sharp jolt may be upon us sooner than later, notwithstanding the direction. The weekly MACD that was earlier decidedly pointing down is kind of flattish now.
Currently net long 72.4k, down 28.8k.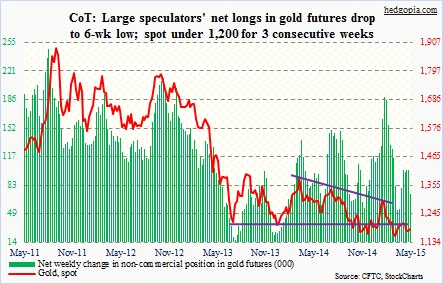
Nasdaq 100 index (mini): On Monday, the index tried to take out the 4480 level but could not get the job done. Even after the Friday rally, it is still under that resistance. The good thing is, buyers showed up near 4340 support on Wednesday. On QQQ, the PowerShares ETF, this corresponds to 106, give and take. The 4480 level corresponds to 109 on the ETF, which it is currently under. This is the hurdle bulls need to jump over.
Not sure if there is any message in non-commercials cutting back net longs in the reporting period. This is their first reduction in five weeks.
Currently net long 66.9k, down 21.5k.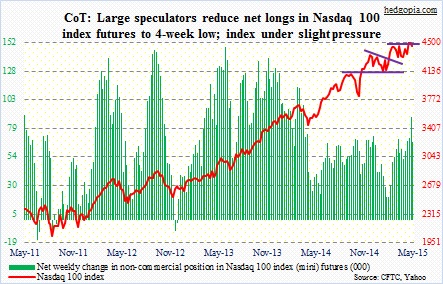
Russell 2000 mini-index: Since 1Q15 GDP print on Wednesday morning last week, the Russell 2000 has lost nearly two percent; in contrast, the S&P 500 is essentially flat.
Up until now, the argument for owning small-caps was: (1) large-caps were getting hurt by a surging dollar, and (2) the U.S. economy was outperforming. 1Q put that to end – or at least helped sow the seeds of doubt.
This is beginning to get reflected in investor behavior.
Non-commercials have raised net shorts to an eight-week high. Post-jobs report on Friday, small-caps underperformed their larger brethren by a substantial margin.
The good thing, if you are a small-cap bull, is that the 1215 level has been saved for now. As a reminder, the RUT broke the mid-October trendline last week.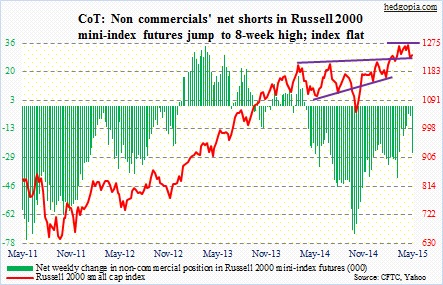
Currently net short 26.7k, up 21.2k.
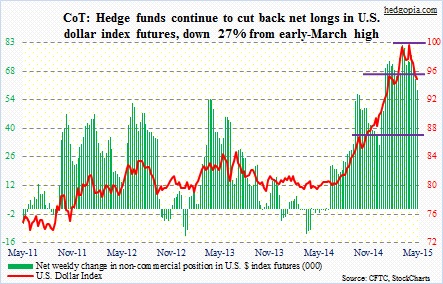
U.S. Dollar Index: On a daily chart, there was one test of the 96 level (support turned into resistance), and that failed. Non-commercials have been cutting back net longs – now down 27 percent from the all-time high of 81.3k contracts early March. For them not to continue to decrease their exposure, macro data needs to improve – fast.
On Friday reacting to the jobs report, the dollar looked confused; it vacillated all day. Yes, the unemployment rate dipped to 5.4 percent (and it is not all due to healthy reasons), but April was the third month in a row that saw a downward revision of the prior month. Wages were disappointing – again.
Currently net long 58.9k, down 5.7k.
VIX: The good: for five months now, spot VIX has not broken 12. It closed at 12.86 on Friday, down a whopping 15 percent. The bad: for the fourth time in the past month, an attempt to rally past 15 has been rejected. And the ugly: non-commercials increased net shorts to an 11-month high. They are going head-to-head with their peers betting on a down SPX. Only one will be right.
Currently net short 75.8k, up 7.1k.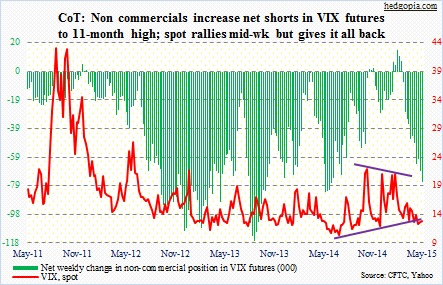
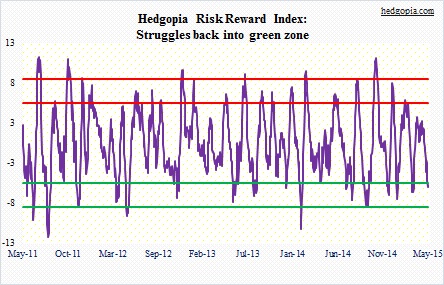
Hedgopia Risk Reward Index