The following are futures positions of non-commercials as of July 21, 2015. Change is week-over-week.
10-year note: Is global growth slowing? The ongoing slump in commodities seems to suggest that. In this scenario, it would make sense for investors to be gobbling up Treasuries on the long end. The 10-year yield fell for the second week – down eight basis points this week. Or is it simply a case of overbought conditions getting unwound? If it is the latter, on a weekly chart, there is room for yields to head lower still.
Interestingly of late, yields on one- and two-year Treasury bills have been under upward pressure. It seems the short end is beginning to buy into FOMC members’ persistent assertion that the process of rate normalization would begin later this year. It is equally possible that the long end is beginning to bet that the short end is right about this and that rate normalization would end up hurting growth and inflation prospects.
For the first time since September 2014, non-commercials have gone net long 10-year-note futures. After having faced stiff resistance at 2.5 percent, 10-year yields broke below 2.3 percent this week.
Currently net long 27.4k, up 33k.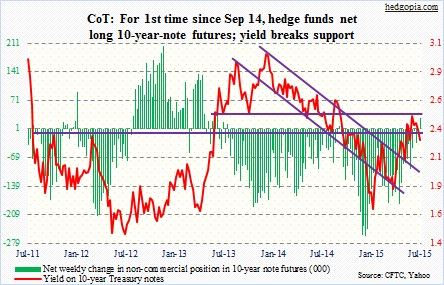
30-year bond: Here are the major economic releases next week.
On Monday, the advance report on durable goods for June is on tap. Since they peaked last September at $74 billion, orders for non-defense capital goods ex-aircraft have lost momentum – down four of the past five months month-over-month and down four months in a row year-over-year. Reflects the sad state of affairs when it comes to capital expenditures.
Tuesday, the FOMC meeting begins, and wraps up the next day. There is no press conference scheduled for Fed Chair Janet Yellen.
Also on Wednesday, the Pending Home Sales Index for June is released. This is based on signed contracts for existing homes, and tends to lead sales of existing homes by a month or two. In May, it rose for the fourth straight month and reached the highest level in nine years. In June, existing home sales reached a seasonally adjusted annual rate of 5.49 million – a post-bubble high; the prior three months were north of five million as well. Will the momentum continue? June’s pending home sales will clue us in.
The advance estimate of second-quarter GDP will be released on Thursday. As of July 17th, the Atlanta Fed’s GDPNow model was forecasting 2.4-percent growth in real GDP. The consensus is higher – at 2.7 percent. Either way, this would represent substantial improvement over the first quarter, which shrank 0.2 percent.
Friday is the Employment Cost Index for the second quarter. It is an important metric, as, unlike average hourly earnings that are released along with the monthly jobs report, it includes both wages and benefits. In the first quarter, private-industry total comp rose 2.8 percent year-over-year, with wages & salaries rising 2.8 percent and benefits 2.6 percent.
For the second week in a row, no Fed official is scheduled to speak.
Currently net short 5.3k, up 328.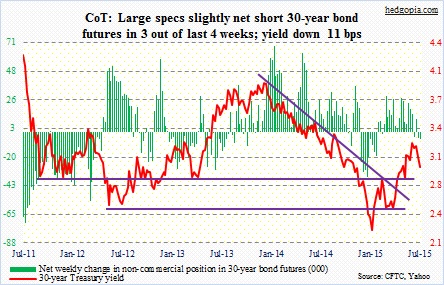
Crude oil: The spot West Texas Intermediate crude is in the process of rapidly unwinding weekly overbought conditions. During the week, fundamentals were not much help either. U.S. crude oil stocks rose 2.5 million barrels in the July 17th week, to 463.9 million barrels. In the April 24th week, inventory peaked at 490.9 million barrels.
Outside the U.S., OPEC has added about 1.5 million barrels a day since February. Downside pressure for oil comes from increased supply from Saudi Arabia and Iraq. Here at home, refining demand is strong. Refineries were running at 95.5 percent capacity. However, the summer driving season is peaking, and there will be lesser need for crude oil.
All these factors combine to create fodder for the bears. And they have succeeded. Support at both 58 and 54 is gone. Now 51 is gone. February/March lows are probably in play.
Non-commercials continue to cut back on net longs – now at a 16-week low.
Currently net long 264.6k, down 14.8k.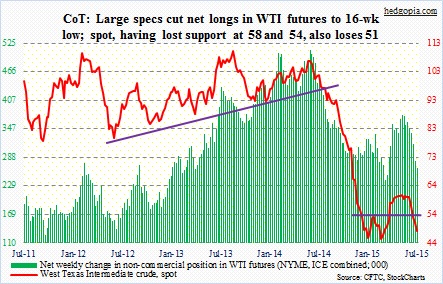
E-mini S&P 500: After staying above the 50-day moving average for eight consecutive sessions, during which the May 20th all-time high was unsuccessfully tested, the S&P 500 has fallen back below it.
It was only a matter of time.
For the past five months, the index has essentially been churning. It has been two months since it made a new high. The May 20th peak has now been tested twice and failed each time (the first test was on June 22nd). Early this month when the index came under pressure, the 200-day moving average provided support. The average (2063.64) is still rising, so a test, which is looking inevitable, will occur at a higher price.
For what it is worth, sales and earnings momentum is in deceleration. In the March quarter, sales for S&P 500 companies fell 2.4 percent year-over-year. If the consensus is right, sales would have fallen another 3.5 percent in the June quarter. This is a headwind for the bulls. They do have one thing that for a while has been in their favor – buybacks. As the earnings season unwinds, can buybacks stem the losses in stocks?
Non-commercials are cutting back on net shorts. Two weeks ago, they raised them to a three-plus-year high. Now they have been cut in half. With that said, their holdings are as of Tuesday. Those who covered/cut missed the two-percent decline in the S&P 500 the past three sessions.
Currently net short 90.5k, down 44.6k.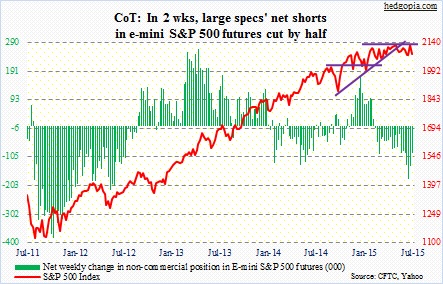
Euro: The ECB expanded its Emergency Liquidity Assistance to Greece by €900 million… The Greek parliament approved the economic reforms program demanded by Greece’s creditors. Greece continues to hit the headlines, but its effect is beginning to wear off.
Near-term, the euro was oversold technically, and it rallied 1.2 percent. In the right circumstances, it has a shot at 111.
Currently net short 113k, up 5.2k.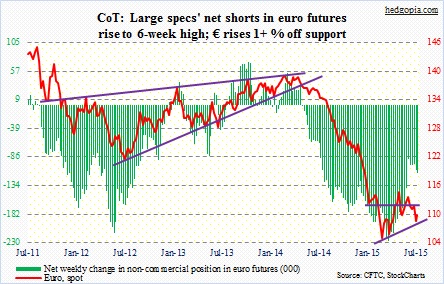
Gold: The rout in gold continued even though Friday saw what could turn out to be an important reversal day. In the meantime, the weakness in precious metals has spread to industrial cousins, from copper to zinc to lead. Not sure what this means for global growth.
China, of course, is a big factor in all this. Is the recent rout in its stock markets already changing consumer behavior? Hong Kong’s jewelry retain chains – ranging from Chow Tai Fook to Luk Fook to Chow Sang Sang – are yet to see a pickup in Chinese buying despite the drop in the metal’s price.
This is also true with India, even though this is not a festive or wedding season just yet. But here is the thing. The Monsoon is falling short this year in that nation. Between June 1 and July 19, cumulative rainfall was eight percent below normal (courtesy of Barclays). The season has been very unpredictable this year. June was above normal. July has fallen short. July and August are critical months for farmers. If this affects crop production, farm income will be adversely impacted, which then can impact demand for gold.
Long-term, though, China is a positive. The disclosure by that nation last week of its gold reserves – 1,658 metric tons, up from 1,054 metric tons in 2009 – was no help to gold. However, the metal now makes up 1.65 percent of China’s foreign exchange holdings, up from 1.1 percent in 2009. For a nation with reserve currency ambitions, this is too low a share.
As far as gold’s near-term direction is concerned, non-commercials continue to shed net longs, to just north of 28,000 contracts. Back in December 2013, they fell to just under 23,000 before rebounding. Once again, the reversal Friday has the potential to be significant.
Currently net long 28.3k, down 19.5k.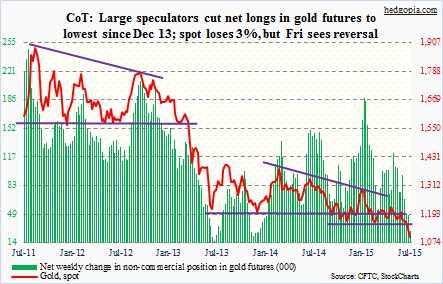
Nasdaq 100 index (mini): On July 20, internals were horrible on the Nasdaq Composite – up volume of 751 million versus down volume of 1.04 billion; 895 advancing issues versus 1,938 declining, and 149 52-week new highs versus 176 lows. Not what one would like to see on a day the index notched an all-time high of 5231.94. Narrow leadership has been the hallmark of the recent advance – something that always comes back to bite on the derriere.
For the week, the index shed 2.2 percent, and is literally sitting on 4550 support. It is a retest of the July 16th breakout. Odds favor the index weakens further.
Of the top five holdings, AAPL and MSFT bombed post-earnings. AMZN and GOOG surged, with both needing to now work through overbought conditions. FB reports next week, and is grossly overbought.
Non-commercials obviously were not expecting the weakness this week. Net longs jumped 56 percent this week, and nearly 200 percent the past couple of weeks.
Currently net long 85.6k, up 30.7k.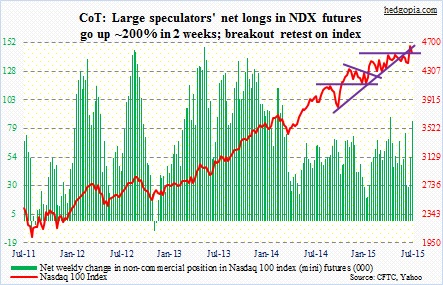
Russell 2000 mini-index: It peaked on July 16, two days before the S&P 500 or the Nasdaq Composite did, and tested the 50-day moving average earlier than the other two indices. As far as investors were concerned, it was risk-off all along.
The index now finds itself a hair’s breadth away from its 200-day moving average – one percent away. The last time the average was tested was early February – a successful one. Will it be the same this time? Just under 19 lies RVX’s (Russell 2000 Volatility Index) 200-day moving average. A rally through that resistance can bring more pain to the small-cap bulls.
Non-commercials continue to be indifferent. They are net short, but not by much.
Currently net short 4.5k, down 3k.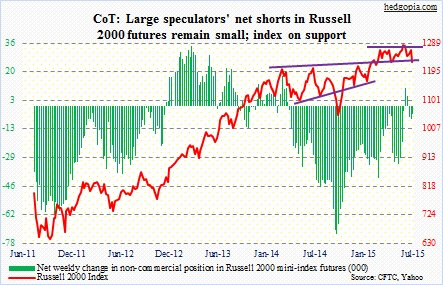
U.S. Dollar Index: It dropped 0.7 percent, and on a daily basis has room to come under more pressure. Non-commercials in the meantime are beginning to go the other way. Their net longs bottomed at just north of 51,000 contracts at the end of June and have since gone up by nearly 11,000 contracts.
Currently net long 62.2k, up 3.6k.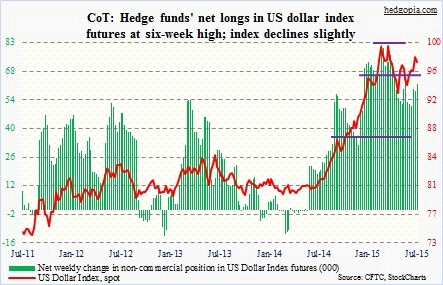
VIX: Quite a ride! In just one month, spot VIX rallied 68 percent, followed quickly by a 48-percent collapse. Now, it is trying to rally again. The June 29th breakout proved to be false. Volatility bulls have their work cut out for themselves. What is working in their favor is the fact that VIX is rising off support – the lower end of the range it has been in. On Friday, it unsuccessfully tried to rally through its 50-day moving average. Only a matter of time before it succeeds.
Of late, August upside calls on VIX have been in demand.
Currently net short 40.9k, up 9.9k.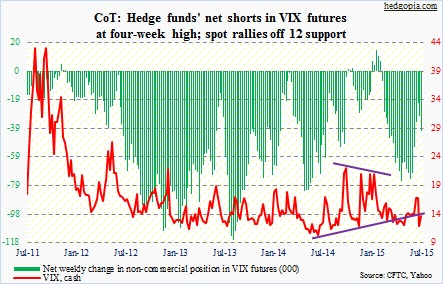
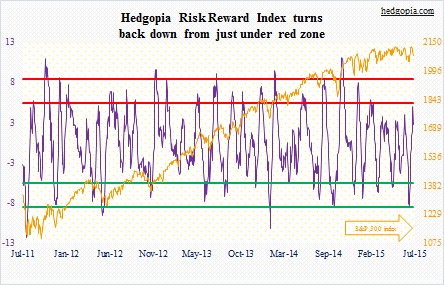
Hedgopia Risk Reward Index