
A week ago last Friday, U.S. stocks opened lower reacting to less-than-expected rise in April’s non-farm payroll. As the session progressed, bids showed up, as traders began to price in lesser odds of a rate hike in June.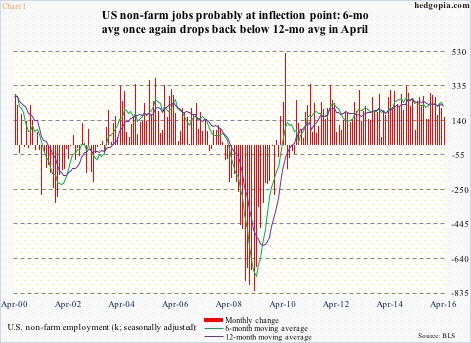
Turns out the U.S. economy only added 160,000 non-farm jobs in April, with the year-to-date average of 192,000. In 2015, payroll averaged 229,000 and in 2014 251,000. Decelerating momentum is evident. In Chart 1, in 10 out of last 14 months the six-month average crossed below the 12-month.
In the meantime, wage growth was subdued. Average hourly earnings of U.S. private employees rose 2.5 percent year-over-year in April. The last time earnings grew with a three handle was in April 2009 (not shown here).
Suppressed wages plus soft payroll growth encouraged traders to take on risk.
A week later – last Friday – they did a 360.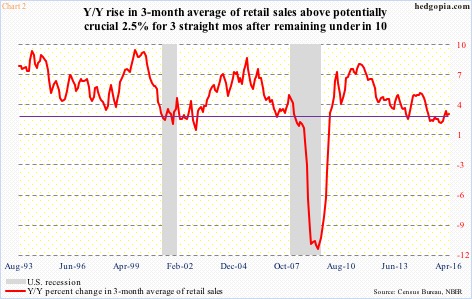
Retail sales for April came in better than expected, rising 1.3 percent month-over-month to a seasonally adjusted annual rate of $453.4 billion. This was the largest growth rate since March last year. Year-over-year, sales rose at a three-percent clip.
Chart 2 plots retail sales using a three-month moving average. In April, they grew 2.8 percent – the third consecutive month of north of potentially important 2.5-percent growth (Chart 2).
Markets interpreted the retail-sales report as good. The yield curve flattened, with the two-year yield unchanged at 0.76 percent and the 10-year down four basis points to 1.71 percent. The Atlanta Fed’s GDPNow forecast for 2Q16 rose from 2.2 percent three days ago to 2.8 percent.
It is also worth recalling that just a day prior three regional bank presidents, all FOMC voting members – Eric Rosengren (Boston), Loretta Mester (Cleveland), and Esther George (Kansas City) – delivered hawkish speeches.
Friday’s retail sales added fuel to the fire. Stocks took it on the chin. Rate-hike fears rose, although not yet evident in Fed funds futures.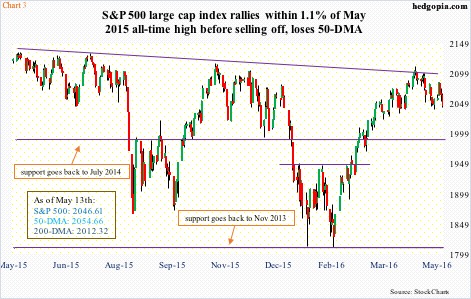
The S&P 500 large cap index (2046.61) lost its 50-day moving average, and is 1.7 percent away from 200-DMA (Chart 3). The Dow Industrials, too, lost 50-DMA, with 200-DMA 2.4 percent from here. The Nasdaq 100 and the Russell 2000 small cap index are below both 50- and 200-DMA.
But how likely is a June hike? The FOMC meets on June 14-15. On June 23rd, Britain votes on whether to leave the European Union. A decision to leave can be messy. That is good enough excuse for the Fed not to move. But in an unlikely event that it does move, how would that reverberate through corporate earnings and the U.S. dollar?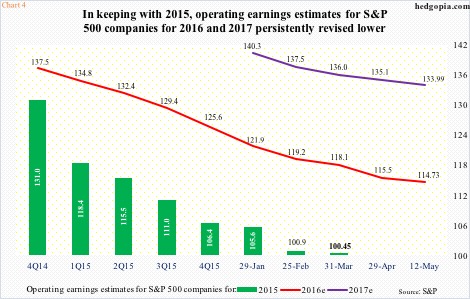
Operating earnings estimates for S&P 500 companies have been under persistent downward revision. At the end of 2Q14, 2015 was estimated to bring in $137.50; actual earnings came in at $105.45, down from $113.02 in 2014.
Similarly, at the end of 4Q14, 2016 estimates stood at $137.50, which have now been revised lower to $114.73. Customarily, 2017 is starting out rosy, but even here, revision trend is downward – from $141.11 in the middle of January this year to $133.99 now (Chart 4).
Earnings will be particularly vulnerable if the U.S. dollar gets another tailwind.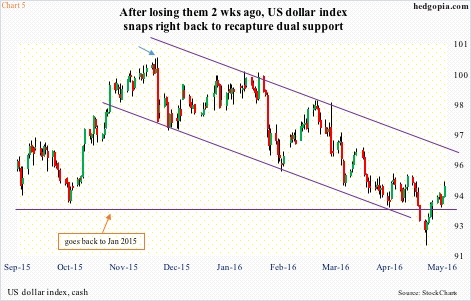
Already, technically, the U.S. dollar index seems to be itching to move higher. It had essentially been trapped in a rectangle since early last year, with the lower end at 92.50-93, which was lost 11 sessions ago. This was preceded by persistent downward pressure since early December last year (blue arrow in Chart 5).
That said, the dollar index has managed to reclaim lost support in no time, and in the right circumstances has tons of room to rally on a weekly chart. This is technical. Higher interest rates will give it a fundamental push.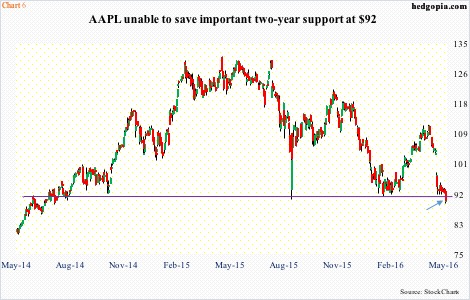
This would have come at a time when major indices look vulnerable, with loss of major averages, as well as other support levels. The Nasdaq 100 (4326.53), for instance, is struggling to save support at 4350. Apple (AAPL), which makes up just north of 10 percent of the index, is not helping. It ($90.52) just lost crucial support at $92, which goes back two years (Chart 6).
This is a market that rallied big off of February 11th lows (Chart 3) and potentially is looking for a reason to go down. Important resistance has held on major indices.
On the S&P 500, the April 20th long-legged doji was a result of rejection at a trend line drawn from the all-time high of May 2015 (Chart 3). On the Nasdaq 100, rejection came at a December 2015 declining trend line, and on the Russell 2000, the belly of a broken March 2009 rising trend line stopped the rally.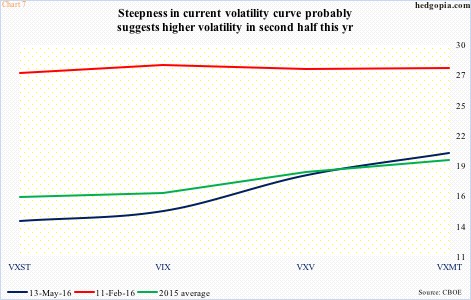
Technically, these could be important developments. Particularly so as the VXST (measures implied volatility of S&P 500 index options over the next nine-day period)-VIX (30 days)-VXV (three months)-VXMT (six months) curve suggests markets are bracing for higher volatility in the second half of the year.
In Chart 7, the dark blue line, representing volatility as of May 13th, is in contango (unlike the red line, which is in backwardation). The longer end of the curve is too steep to take comfort.
In this context, a hawkish Fed probably results in a spike in shorter-term volatility measures. Not so if the Fed maintains the status quo – probable. In the latter scenario, the risk is for the S&P 500, for instance, to go test 200-DMA (Chart 3). The index by then would have dropped just under five percent from the April 20th high. By which time put-to-call ratios would probably have risen to the extreme levels of August/September last year.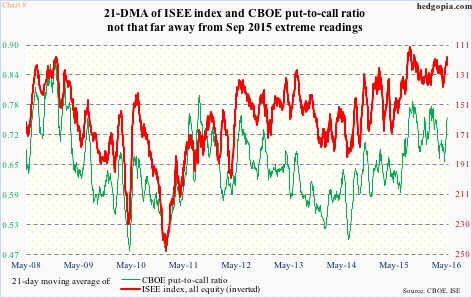
The CBOE put-to-call ratio spiked to 0.785 on September 18th – now 0.751 – and the ISE call-to-put ratio collapsed to 112.6 on August 27th – now 119.1 (Chart 8). Once readings get this high/low, excesses get unwound in due course… at least that is what the past has shown us.
Thanks for reading!
