Following futures positions of non-commercials are as of September 18, 2018.
10-year note: Currently net short 684.7k, up 2k.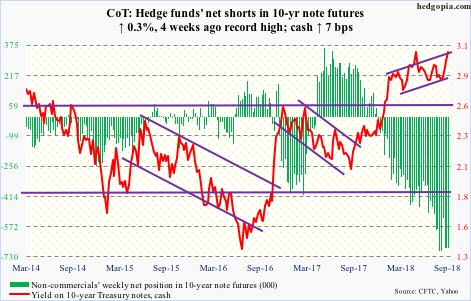
The 10-year Treasury rate (3.07 percent) has once again reached a battle zone. The last time these notes yielded just north of three percent before coming under sustained pressure was December 2013, when it retreated after hitting 3.04 percent. By July 2016, they were yielding 1.34 percent – an all-time low. In April this year, the 10-year not only surpassed three percent but also broke out of a three-decade descending channel. Yet, convincingly taking out this resistance has proven difficult. A genuine breakout has the potential to take out stops and self-fulfill. Shorts, including non-commercials, will be justified. They have done very well in the past year. A year ago, they were net short 270,120 contracts when the cash bottomed at 2.03 percent. Now, they are net short 684,712 contracts. While this aggressive buildup in net shorts worked in their favor, this very factor can act in reverse should bond bears once again get denied at the current level. TLT (iShares 20+ year Treasury bond ETF) just tested a make-or-break support just north of $116 (more on this here). Bears need a breakdown in the ETF. Else, in due course they risk a squeeze, particularly if US macro data begins to decelerate, which is increasingly looking probable in quarters ahead.
30-year bond: Currently net short 66.9k, up 19.8k.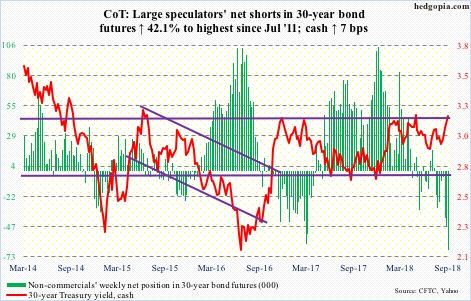
Major economic releases next week are as follows.
The S&P Case-Shiller home price index for July comes out Tuesday. Nationally, US home prices rose 6.2 percent year-over-year in June. Prices have decelerated slightly since rising 6.5 percent in March, but they are still appreciating much faster than inflation.
Also Tuesday, FOMC meeting begins. A 25-basis-point hike is priced in. After this, the fed funds rate will be between 200 and 225 basis points. There will be a post-meeting press conference by Jerome Powell, Fed chair. Markets will be on pins and needles as to if he would care to comment on the likely path ahead, particularly next year. Currently, futures have priced in 86-percent odds of another 25-basis-point raise in the December meeting.
August’s new home sales are due out Wednesday. July was down 1.7 percent month-over-month to a seasonally adjusted annual rate of 627,000 units. Last November’s 712,000 units was the highest since October 2007.
Thursday brings GDP (2Q18, third estimate), corporate profits (2Q18, revised) and durable goods orders (August, advance).
The second estimate showed GDP advanced 4.2 percent in 2Q. This was the fastest growth rate in 15 quarters.
Preliminarily, corporate profits adjusted for inventory and capital consumption grew 7.7 percent y/y to $2.25 trillion (SAAR). This too was the fastest growth rate in 15 quarters.
July orders for non-defense capital goods ex-aircraft – proxy for business plans for capex – jumped 8.8 percent y/y to $69.9 billion (SAAR), $42 million short of matching the cycle high from March 2012.
On Friday, personal income (August) and University of Michigan’s consumer sentiment index (September, final) are on tap.
Core PCE (personal consumption expenditures) increased 1.98 percent in the 12 months to July. This measure of consumer inflation is the Fed’s favorite. The July increase is as good as two percent, but the last time inflation actually increased with a two handle was in April 2012.
Preliminarily, consumer sentiment jumped 4.6 points m/m in September to 100.8. March’s 101.4 was the highest since January 2004.
Crude oil: Currently net long 586.7k, down 11.4k.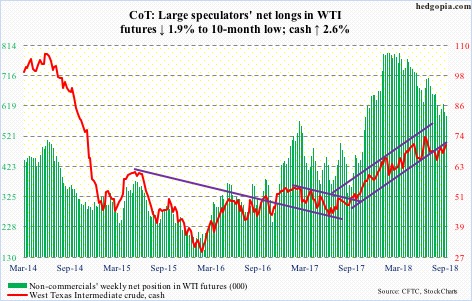
In the week ended September 14, US crude production rose 100,000 barrels per day to 11 million b/d. Production has remained stuck at 11 mb/d the past couple of months. The EIA report also showed crude stocks fell 2.1 million barrels to 394.1 million barrels. This was the second straight sub-400 million reading. Gasoline stocks also fell, down 1.7 million barrels to 234.2 million barrels. But distillate stocks grew by 839,000 barrels to 140.1 million barrels – a 31-week high. Crude imports were up 433,000 b/d to eight mb/d. Refinery utilization shrank 2.2 percentage points to 95.4 percent.
This month, spot West Texas Intermediate crude ($70.78/barrel) has been denied at $71-plus five times, including the last three sessions this week. The crude has struggled to get going since it was rejected early July at multi-year resistance at just north of $75. It is currently testing the daily upper Bollinger band. The lower band lies at $67.34.
E-mini S&P 500: Currently net long 150k, up 27.7k.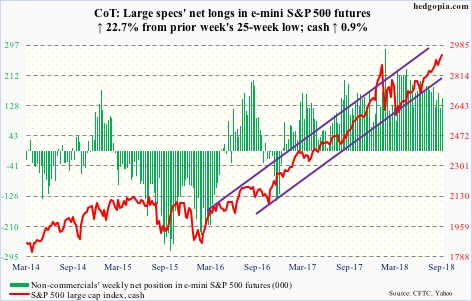
A new high! After defending the January high several times in the first two weeks this month, the cash (2929.67) once again broke out Thursday. It is now up 9.6 percent this year. This is remarkable given major sources of buying, including margin debt, foreigners’ purchases of US stocks and fund flows, have softened this year. Corporate buybacks are still going strong, though (more on this here).
In the week through Wednesday, flows were positive, with SPY (SPDR S&P 500 ETF) gaining $2.7 billion, VOO (Vanguard S&P 500 ETF) $2.5 billion and IVV (iShares core S&P 500 ETF) $189.4 million (courtesy of ETF.com). In the same week, US-based equity funds (including ETF’s) took in $998 million (courtesy of Lipper.com).
For now, bulls have put their foot down. Let us see how far they can take it. They have the momentum, although the daily chart is beginning to get overbought. Nearest support lies at 2917, and 2870s after that.
Euro: Currently net long 1.7k, down 9.5k.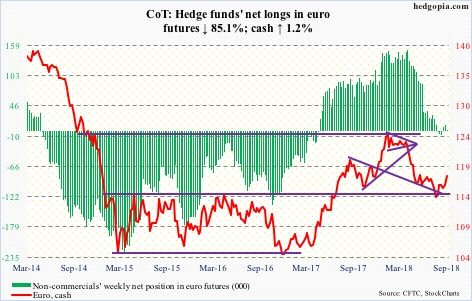
The cash ($117.62) Thursday broke out of a falling trend line from June. This preceded persistent defense going back to late May of $115, which has proven to be an important level for nearly four years now. There was a brief drop to $113.01 intraday mid-August, other than that euro bulls hung on. The 50-day moving average has gone flat. For continued momentum, bulls need to take out $118-plus.
Gold: Currently net short 10.8k, up 3.3k.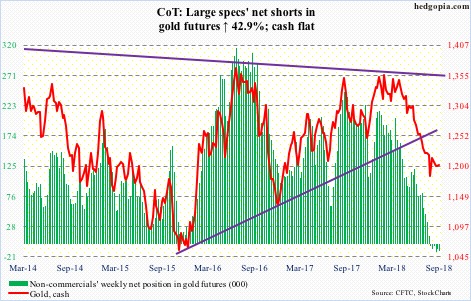
Base-building continues on the cash ($1,201.3/ounce). Gold dropped intraday from $1,369.4 in April to $1,167.1 mid-August. It has essentially gone sideways for six weeks now. Support-turned-resistance at $1,213-ish is currently acting as a roadblock. The 50-day lies right there. A breakout here will be significant. Daily Bollinger bands have tightened, which more often than not precedes a sharp move. Gold bugs hope this is to the upside. Improvement in flows will help.
In the week through Wednesday, GLD (SPDR gold ETF) lost $113 million, while IAU (iShares gold trust) gained $45 million (courtesy of ETF.com).
Nasdaq 100 index (mini): Currently net long 29.3k, down 5.4k.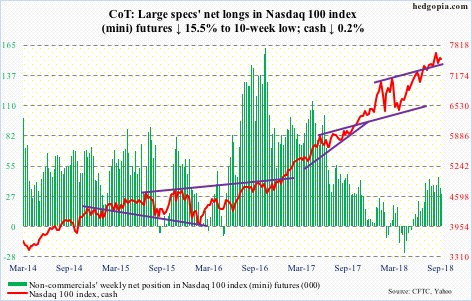
Once again, bulls stepped up to save the 50-day on the cash (7531.07). In the past 12 sessions, the average has been tested eight times. While positive, this also reflects bulls’ inability to lift right off of the average. This is a yellow flag medium- to long-term. The week produced a weekly long-legged doji. The Nasdaq 100 index is still below its all-time high of 7691.1 from late August. For eight months now, it has traded within an ascending channel, the upper bound of which lies around 7750, which is a best-case scenario for the bulls for now.
For the second week running, QQQ (Invesco QQQ Trust) saw redemptions – $410 million in the week to Wednesday in addition to prior week’s $1.3 billion (courtesy of ETF.com).
Russell 2000 mini-index: Currently net long 1k, down 196.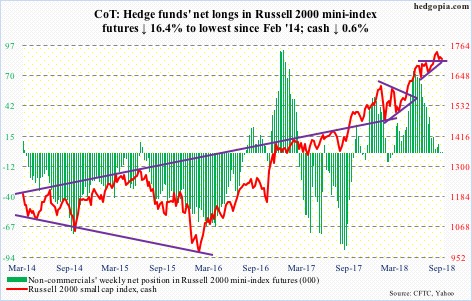
For over two weeks now, the cash (1712.32) has essentially gone sideways – perfect environment for non-directional trades using options. Early this week, breakout retest at 1710-ish failed, but only to see small-cap bulls step up and defend the 50-day (1700.83). Conviction is lacking, though. The Russell 2000 closed out the week right on support, even as the weekly chart just developed a potentially bearish MACD cross-under.
In the week to Wednesday, IWM (iShares Russell 2000 ETF) lost $324 million, while IJR (iShares core S&P small-cap ETF) attracted $220 million (courtesy of ETF.com).
US Dollar Index: Currently net long 37.5k, up 3k.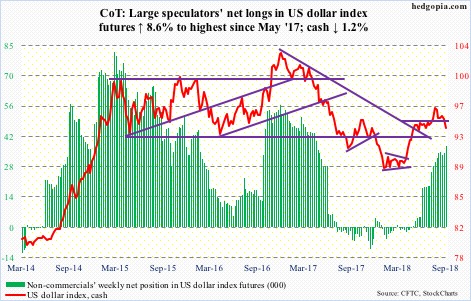
Early August, the cash (93.80) did break out of 95-plus, culminating in 96.87 intraday by the middle of the month. The breakout was false. This week, a potentially bearish MACD cross-under completed, and the US dollar index shed 1.2 percent. The 50-day is gone, with the 200-day at 92.44. The daily chart is getting oversold. Nearest resistance lies at 94.30.
VIX: Currently net short 119.8k, down 658.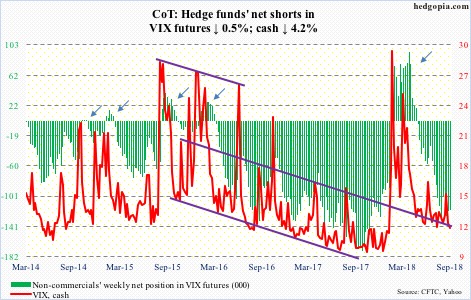
Thursday, the cash (11.68) found support just above the daily lower Bollinger band to end the session with a dragonfly doji, which could signal a bullish reversal. Friday, the band was tested again before ending with a spinning top. Several times in the past, VIX has rallied decently after finding support at the lower Bollinger band.
In the meantime, the 21-day moving average of the CBOE equity-only put-to-call ratio ended the week at 0.589, which is low. On January 26 when the S&P 500, and several other major US indices, peaked before a quick, double-digit, two-week drop, the ratio bottomed at 0.543. Should the ratio get anywhere close in the next several sessions, that would absolutely be the time to get out the caution hat.
Thanks for reading!

