
Following futures positions of non-commercials are as of July 2, 2019.
10-year note: Currently net short 288.9k, up 7.8k.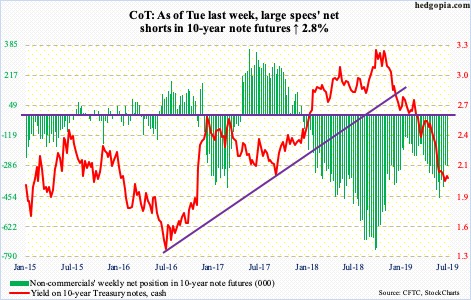
Fed Chair Jerome Powell appears before Congress this week. This comes on the heels of a strong payroll report in June. A total of 224,000 non-farm jobs were created last month, for a monthly average this year of 172,000, versus last year’s monthly average of 223,000. That said, given there have been two sub-100,000 months this year – 56,000 in February and 72,000 in May – June’s showing is quite strong. Friday, the 10-year Treasury yield rallied 10 basis points and the two-year 11 basis points. The latter tends to be most sensitive to markets’ monetary policy expectations.
Fed funds futures continue to price in a 25-basis-point cut each in July and September, with December a toss-up. June’s strong payroll report did not make much of a dent in these expectations. In the June meeting, FOMC members did seem to open the door to the possibility of easing. After June’s employment report, it is possible they – at least some – will rethink their easing bias. In this regard, should Mr. Powell wish to let markets know that the latter is harboring unrealistic expectations, he will have an opportunity to do so in this week’s Humphrey-Hawkins testimony. This scenario can have implications for a whole host of assets, not the least of which are equities, which are not cheap by any stretch of the imagination (more here).
30-year bond: Currently net long 635, down 15.6k.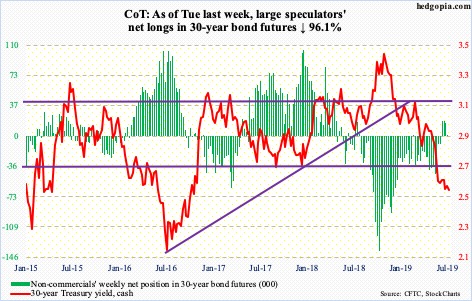
Major economic releases this week are as follows.
Tuesday, the NFIB optimism index (June) and JOLTS (May) are scheduled.
Small-business optimism rose 1.5 points month-over-month in May to 105. This was the 30th consecutive month of 100-plus reading, including last August’s record 108.8.
Non-farm job openings in April dropped 25,000 m/m to 7.45 million. Last November’s 7.63 million was the highest ever.
Wednesday and Thursday, Mr. Powell testifies before Congress.
Also Wednesday, FOMC minutes from the June meeting (18-19) are published.
Thursday, June’s CPI is on tap. In May, both CPI and core CPI inched up 0.1 percent m/m. In the 12 months to May, they respectively rose 1.79 percent and 1.99 percent. This was the first sub-two core CPI reading after 14 straight months with a two handle.
PPI for June comes out Friday. Producer prices increased 0.1 percent m/m and 1.8 percent year-over-year. Core PPI rose 0.4 percent m/m in May and 2.3 percent in the 12 months to May.
Crude oil: Currently net long 562.8k, up 15.5k.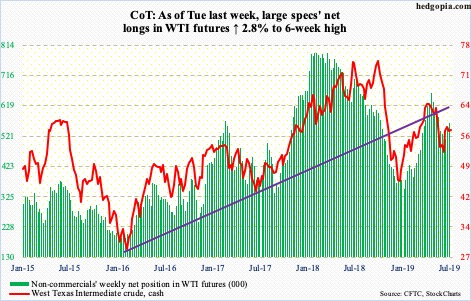
From April 23 to June 5 intraday, the cash ($57.66/barrel) went from $66.60 to $50.60, before rallying to $60.28 by July 1. The high five sessions ago essentially tested a falling trend line from the April peak. So far, it has held, and will likely continue to so – at least near term.
Tuesday last week, the crude sliced through both the 50- and 200-day. The averages were tested Monday – unsuccessfully. There is room for the daily to continue lower. Bulls need to defend support at $54-55.
The EIA report for the week of June 28 was a mixed bag. US refinery utilization was unchanged at 94.2 percent. Stocks of both crude and gasoline fell – down 1.1 million barrels and 1.6 million barrels to 468.5 million barrels and 230.6 million barrels respectively. Distillates, however, increased 1.4 million barrels to 126.8 million barrels. As did crude production and imports, which respectively rose 100,000 barrels per day and 929,000 bpd to 12.2 million bpd and 7.6 mbpd.
E-mini S&P 500: Currently net long 53.1k, down 33.4k.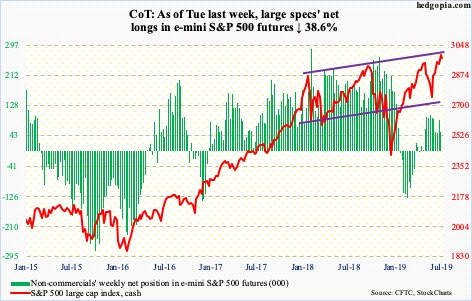
The cash (2975.95) enjoyed a mini-breakout last week. The intraday high of 2964.15 from June 21 was taken out Monday, followed by a further buildup through the rest of the week, including Friday when early weakness was bought. Thursday’s new all-time high of 2995.84 kissed the daily upper Bollinger band. The daily is overbought, with the RSI dropping back below 70 last week with a brief stay above. Depending on what comes out of the Humphrey-Hawkins testimony, the risk for the S&P 500 is down. Last week’s high kissed a rising trend line drawn from the closing highs of January and September last year.
Importantly, the index rallied to a new high last week, but flows were not in cooperation. In the week to last Wednesday, US-based equity funds lost $19.8 billion (courtesy of Lipper). In the same week, SPY (SPDR S&P 500 ETF), VOO (Vanguard S&P 500 ETF) and IVV (iShares core S&P 500 ETF) lost a combined $7.6 billion (courtesy of ETF.com).
Euro: Currently net short 31.7k, down 24.6k.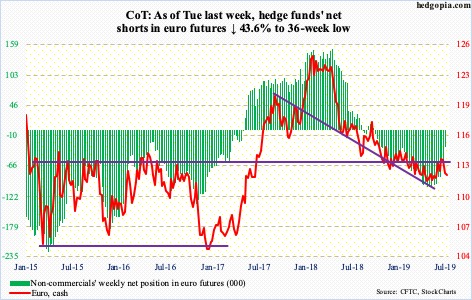
The cash ($112.17) opened last week with a sharp breach of the 200-day and ended right on the 50-day. The latter was lost this Monday. This preceded a rally to $114.06 10 sessions ago. The euro began to rally late May after defending just north of $111 for a month. Once again, bulls may have to defend this level, particularly if they are unable to save $112.
Non-commercials continue to cut back their net shorts.
Gold: Currently net long 258.9k, up 22.4k.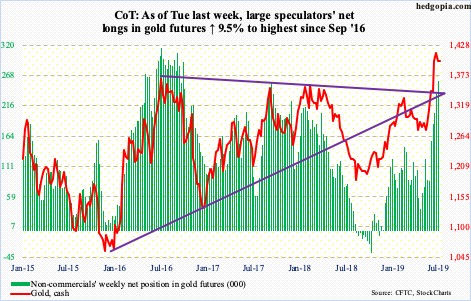
Two weeks ago, when the cash ($1,400/ounce) rallied to $1,442.90, a weekly shooting star formed. This was followed by a weekly long-legged doji. This price action preceded a 14-percent rally that began late May. This move was fully aided by flows.
In the week to last Wednesday, GLD (SPDR gold ETF) took in $28 million and IAU (iShares gold trust) $135 million (courtesy of ETF.com). This was IAU’s third positive week in 12. In the prior six, GLD gained $2.8 billion. Non-commercials similarly have been aggressively adding to net longs.
All this enabled gold to score a major breakout at $1,350s-1,360s, at the same time also pushing it into overbought territory. The daily MACD just developed a potentially bearish MACD cross-under. In the weeks ahead, the yellow metal could very well be eyeing a retest of that breakout.
Nasdaq 100 index (mini): Currently net long 24.6k, up 2k.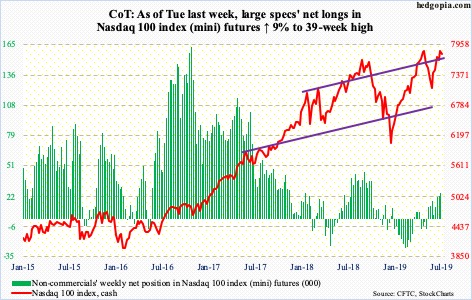
The cash (7785.79) last Wednesday scored a new intraday high, but barely – 7857.69 versus 7851.97 from April 25. A decisive breakout can feed on itself. Alternatively, last week’s candle could very well turn out to be a hanging man, which is a bearish reversal pattern. Late April, a similar candle appeared right before the Nasdaq 100 came under pressure throughout May. This week’s action is worth watching.
In the week to last Wednesday, QQQ (Invesco QQQ trust) lost $2.6 billion (courtesy of ETF.com). This pretty much offset the $2.8 billion in inflows in the prior week.
Russell 2000 mini-index: Currently net short 74.8k, up 11.1k.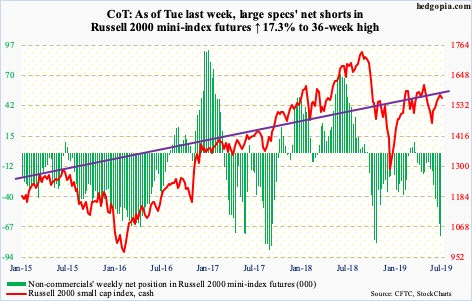
The cash (1561.39) rallied the last five weeks. Last week, it was up 0.6 percent, but a long-legged doji showed up as well. Last week’s performance by the Russell 2000 index paled in comparison to the S&P 500’s 1.7 percent and the Nasdaq 100’s 2.2 percent. Small-caps continue to lag their large-cap peers.
The Russell 2000 is currently above both the 50- and 200-day. Resistance just north of 1600 is solid as rock. The intraday high of 1586.77 on Monday last week was the closest the index came toward challenging that resistance in the past couple of months. Until this ceiling is broken through, it is going to be a tough going for bulls.
In the week to Wednesday, IWM (iShares Russell 2000 ETF) took in $319 million and IJR (iShares core S&P small-cap ETF) $12 million (courtesy of ETF.com).
US Dollar Index: Currently net long 22.4k, up 51.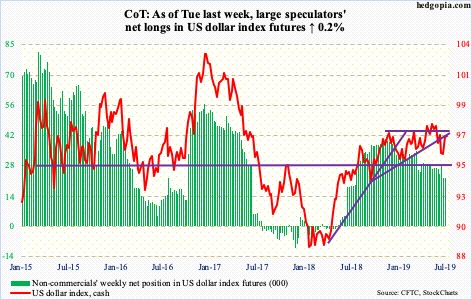
The cash (96.98) had a strong week last week, up 1.3 percent. The week before was a doji week. Last week’s rally also enabled the US dollar index to reclaim the broken trend line from last September around 96.60. Bulls would love to test 97.50s, and for that the 50-day (97.03) needs to be recaptured. Last Friday, the average was tested – unsuccessfully; Monday, the index edged up to close right underneath.
VIX: Currently net short 124.2k, up 7.5k.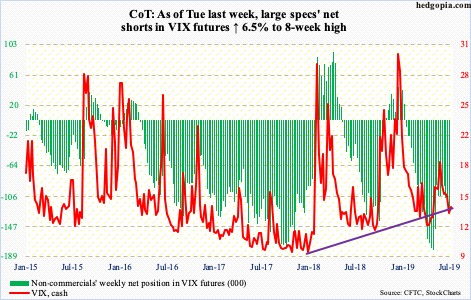
Last Friday, the cash (13.96) had a wild session, with a high of 14.47 and a low of 12.04, ending with a very wide spinning top. That session low essentially tested the 11-12 range that consistently provided support the last three months. It is only after this support is genuinely breached VIX runs a risk of dropping toward 10-11. Thus far, this is not the path of least resistance. The daily can rally.
In the meantime, the VXST-VXMT spread is currently near a level that in the past coincided with a decent peak in the S&P 500.
Thanks for reading!
