
Following futures positions of non-commercials are as of Aug 22, 2017.
10-year note: Currently net long 261.2k, up 60.7k.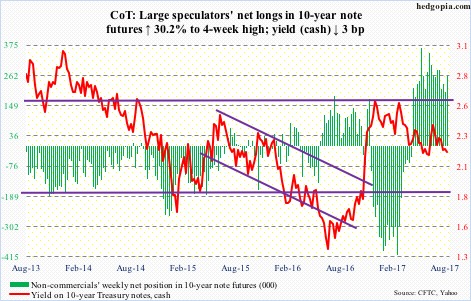
Fed funds futures are currently pricing in 40 percent odds of a 25-basis-point increase in December, while September and November are in single digits. This year, the Fed hiked twice – one each in March and June. The dot plot has indicated all along they would like to move at least one more time this year.
Markets are not convinced.
First, if the Fed is seriously considering balance-sheet normalization beginning later this year, then it arguably would not want to double-tighten. The U.S. economy – in its ninth year of recovery – is hardly accelerating.
Second, particularly post-financial crisis, in markets versus the Fed, the latter always blinked first. As soon as QE1 ended in March 2010, U.S. stocks threw a tantrum. They wanted and got QE2, which ended in June 2011. Once again, stocks began acting up and got QE3.
In 2013, when Ben Bernanke, then-Fed chair, floated the idea of tapering QE, markets threw a fit. The Fed backed off.
Third, the Fed has a dual mandate – maximum employment and price stability. The unemployment rate in July was 4.3 percent. But core PCE has been below the Fed’s target of two percent since May 2012.
Curiously, the Fed is focused more on inflation shortcomings.
This is all good, except that in due course it can prove costly.
As both the short and long end of the yield curve stays distorted, asset inflation is the by-product. Janet Yellen, Fed chair, occasionally talks about elevated multiples in stocks, but this is not what drives policy decision. Hence markets’ unwillingness to take the Fed’s word for it.
The solution? Surprise the markets. Is the Fed up for it? We will find out in the next few months.
30-year bond: Currently net long 76.7k, up 3.1k.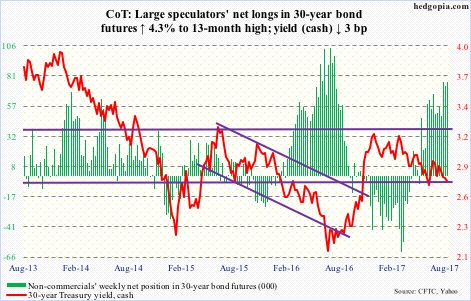
Major economic releases next week are as follows.
The S&P Corelogic Case-Shiller U.S. home price index for June comes out on Tuesday. Nationally, prices rose 5.6 percent year-over-year in May.
GDP (2Q17; preliminary) and corporate profits (2Q17, preliminary) are on tap for Wednesday.
The advance (first) estimate showed 2Q17 real GDP grew at a seasonally adjusted annual rate of 2.6 percent. This was faster than the post-Great Recession average of 2.2 percent but much slower than the long-term average (going back to 2Q47) of 3.2 percent.
Corporate profits adjusted for inventory valuation and capital consumption increased 3.3 percent y/y in 1Q17 to $2.11 trillion (SAAR). This was the second straight y/y rise after five consecutive declines. Profits peaked at $2.23 trillion in 4Q14.
Thursday brings personal income and spending (July) and the pending home sales index (July).
In the 12 months to June, core PCE rose 1.51 percent.
In June, pending home sales rose 1.6 points month-over-month to 110.2. A decade-high 113.6 was reached in April last year.
Employment (August), the ISM manufacturing index (August), and the University of Michigan’s index of consumer sentiment (August, final) are scheduled for Friday.
Non-farm payroll in July grew 209,000 m/m to 146.6 million. Year-to-July, payroll averaged a monthly increase of 184,000. This compares to the 2016 average of 187,000, which decelerated from 226,000 in 2015 and 250,000 in 2014.
Manufacturing activity in July fell 1.5 points m/m to 56.3. June’s 57.8 was the highest since 57.9 in August 2014. Similarly, orders fell 3.1 points m/m to 60.4. February’s 65.1 matched December 2013.
Preliminarily, consumer sentiment in August jumped 4.2 points m/m to 97.6, merely nine-tenths of a point from January’s (2017) 13-year high. Sentiment jumped post-election last year – October was 87.2.
Crude oil: Currently net long 431.7k, down 21.7k.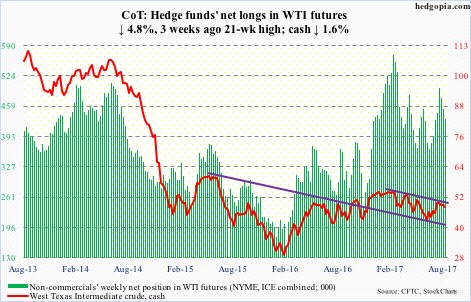
U.S. crude stocks continued to drop.
For the week ended August 18, the EIA report showed crude inventories fell by another 3.3 million barrels to 463.2 million barrels. This was the eighth straight weekly drop. From the all-time high 535.5 million barrels in the March 31st week this year, stocks are now down 72.4 million barrels.
Gasoline stocks dropped too – by 1.2 million barrels to 229.9 million barrels. Distillates, however, inched up 28,000 barrels to 148.4 million barrels.
As did crude imports, which grew 664,000 barrels/day to 8.79 million b/d – a 17-week high.
Crude production continued to increase, rising 26,000 b/d to 9.53 mb/d. Since OPEC reached an agreement to cut back production by 1.8 mb/d last November, U.S. production has gone up by 829,000 b/d.
In the meantime, refinery utilization inched down seven-tenths of a point to 95.4 percent.
Spot West Texas Intermediate crude continues to trade between its 50- and 200-day moving averages. Less than three points separate the two.
On the weekly chart, there is room for the crude to continue lower. The picture changes if it breaks out of a falling trend line from February around $50/barrel.
E-mini S&P 500: Currently net long 142.1k, down 8.1k.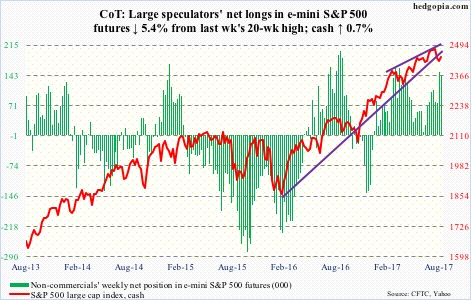
Monday’s hammer reversal laid the groundwork for a relief rally. At the same time, bears predictably showed up at resistance.
Since peaking on August 8 at 2490.87, the cash has made lower highs, which will be broken around 2455. As well, the 50-day lies at 2450, and the average is resisting rally attempts. Both were tested Friday – unsuccessfully.
In the week to Wednesday, U.S.-based equity funds lost another $3.4 billion. Outflows totaled $16.2 billion in the last six (courtesy of Lipper).
Although during the same week S&P 500-focused ETFs took in $2 billion, with SPY (SPDR S&P 500 ETF) and VOO (Vanguard S&P 500 ETF) respectively attracting $2 billion and $199 million, and IVV (iShares core S&P 500 ETF) losing $233 million (courtesy of ETF.com).
Euro: Currently net long 88k, up 8.7k.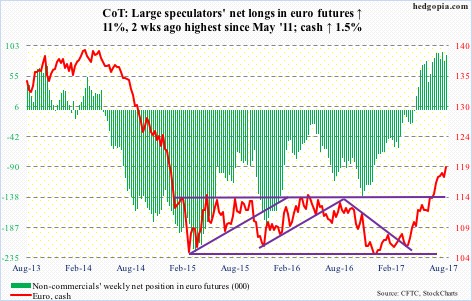
Mario Draghi, ECB president, did not disappoint. At Jackson Hole, he was not expected to deliver a new policy message, and he was as vague as he could be.
Leading up to his Friday speech, the cash was up 0.4 percent for the week, and rallied another one percent Friday. It is up 15-plus percent this year.
Daily Bollinger bands have tightened.
In less than two weeks, the ECB’s governing council meets. Markets are likely to react.
The euro remains overbought, with momentum intact.
Gold: Currently net long 208.4k, up 20.7k.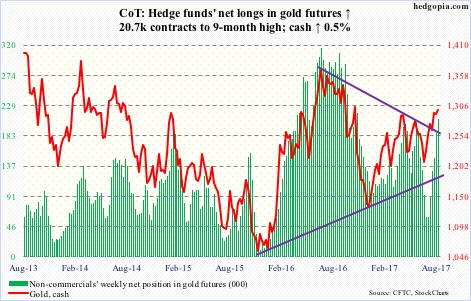
GLD (SPDR gold ETF) saw more inflows.
In the week ended Wednesday, it took in $159 million. This followed inflows of $352 million in the prior week (courtesy of ETF.com).
Gold bugs keep hammering on resistance at $1,300/ounce on the cash ($1,297.9). A breakout will be significant.
This year, the metal is up 12.7 percent, versus 9.1 percent for the S&P 500!
Nasdaq 100 index (mini): Currently net long 39.1k, down 8.1k.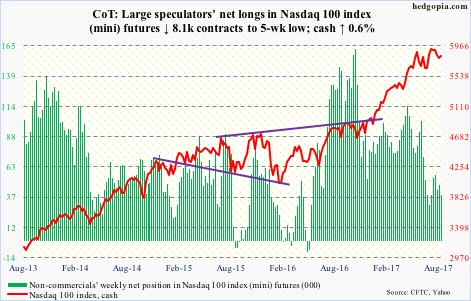
Since peaking at 5995.77 on July 27, the cash (5822.53) has made lower highs. This gets broken around 5920. This is an important hurdle facing the bulls. Before that lies horizontal resistance at 5880, which was just about tested several times this week.
Flows into QQQ (PowerShares QQQ trust) continue to be inconsistent. In the week to Wednesday, $901 million was redeemed. This followed $431 million in inflows in the prior two.
There is support at 5570, and after that 5450.
Russell 2000 mini-index: Currently net short 81.7k, up 2k.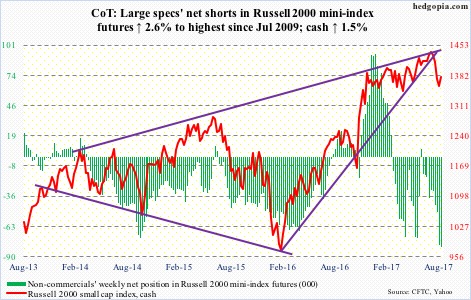
Last week’s defense of range support is intact. Except for a brief breakout in May, the cash (1377.45) traded between 1340s and 1390s for months. It is now back into the range.
Encouragingly for small-cap bulls, IWM (iShares Russell 2000 ETF) in the week through Wednesday took in $780 million. But resistance is galore.
Immediately above, the 200-day (1380) lies, which was tested Friday, followed by top-of-range resistance, and then the now-dropping 50-day (1409).
Non-commercials are most net short since July 2009. In the right circumstances, this can be a potential source of squeeze, but for that to possibly happen the bulls need to first take out the 200-day.
US Dollar Index: Currently net short 1.4k, down 688.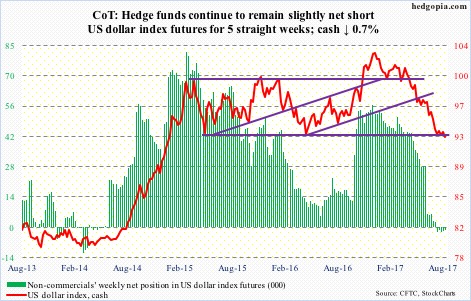
The cash (92.68) gets no love. Not from non-commercials anyway, who continue to adopt a wait-and-see approach.
The August 2 low of 92.39 was violated intraday Friday. Dollar bulls always struggled at near-term resistance at 93.65. Support at 92, which goes back to at least 1998, is in play again. It is a must-hold.
VIX: Currently net short 105.3k, down 24.1k.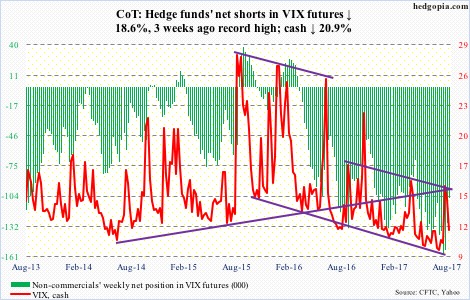
If the cash (11.28) closes out the month near where it trades, this would be six consecutive monthly candles with a long tail.
For the most part, volatility has remained suppressed, and the occasional spikes have quickly been sold.
The difference this time is that VIX has refused to drop right back into 9s and 10s. The bulls were unable to save the 200-day Friday but are hanging on to the 50-day.
In the meantime, the spread between VXST (nine days) and VXMT (six months) ended the week at -6.5 points. Premium is being squeezed out of short-term protection. The contango is steep enough for the short end of the volatility curve to begin to attract bids again.
Thanks for reading!
