
Following futures positions of non-commercials are as of April 21, 2020.
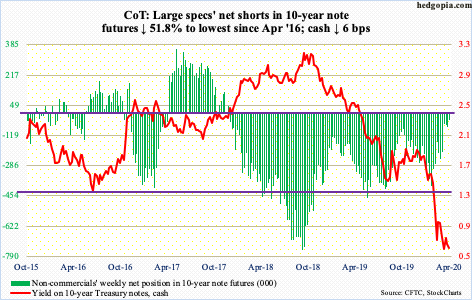
10-year note: Currently net short 34.1k, down 36.7k.
The FOMC meets next week. A two-day meeting begins Tuesday. This comes after March’s hectic schedule which included two unscheduled meetings.
On March 3rd, the Fed cut the fed funds rate by 50 basis points to a range of 100 to 125 basis points. This was the first 50-basis-point cut since December 2008. In 2019, there were three 25-basis-point cuts.
On the 15th (Sunday), the Fed acted again. It lowered the benchmark rate to zero to 25 basis points and said it would buy more Treasury and mortgage-backed securities. On the 23rd, it announced it would buy these securities in the amounts needed, meaning an open-ended QE was begun. It also ventured into investment-grade corporate bonds.
On April 9th, up to $2.3 trillion in loans to support municipal and junk debt was announced.
In other words, the Fed now directly finances the various facets of the economy. This is a first. We can debate all we want if it is a good policy to be buying corporate debt, let alone junk, but markets for now have to deal with this. Perhaps important from a longer-term perspective is that, once in, it will be difficult for the Fed to walk back. Several times since the financial crisis, markets have revolted as soon as they find out the Fed plans to unwind its balance sheet. It is now $6.6 trillion boated – and headed higher.
After all that has happened the last eight weeks, not much is expected to come out of next week’s meeting. As far as markets are concerned, it should be a yawner.
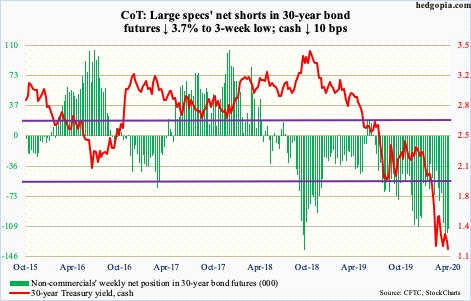
30-year bond: Currently net short 112.4k, down 4.3k.
Major economic releases next week are as follows.
Tuesday brings the S&P Case-Shiller home price index (February). Nationally, January home prices rose 3.9 percent year-over-year. Prices have trended higher since last August when they rose 3.1 percent.
GDP (1Q20, first estimate) is due out Wednesday. In 4Q19, real GDP grew 2.1 percent. As of April 24th, the Atlanta Fed’s GDPNow model forecasts the economy to shrink 0.3 percent in 1Q20.
Personal income/spending (March) and the employment cost index (1Q20) are scheduled for Thursday.
In the 12 months to February, core PCE – the Fed’s favorite measure of consumer inflation – increased 1.82 percent, which was a 14-month high.
Total compensation in the private sector rose 2.7 percent y/y in 4Q19. Growth has been sub-three percent since 2Q08.
The ISM index (April) comes out Friday. Manufacturing activity fell a point month-over-month in March to 49.1. This was the sixth sub-50 reading in eight months.
WTI crude oil: Currently net long 756.9k, up 80.1k.
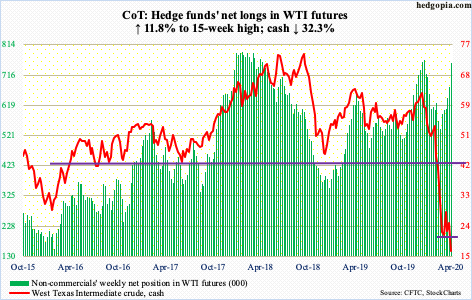
Tuesday, the cash ($16.94/barrel) pierced through support at $19-20, touching $6.50 intraday! As crazy as this move was, real action took place elsewhere.
West Texas Intermediate crude oil for front-month May delivery, which was set to expire Tuesday, settled Monday at -$37.63 – a one-day drop of $55.90! That is not a typo. Sellers were indeed paying buyers $37.63 to take away their oil, as a glut combined with a lack of storage capacity reverberated through futures contracts, which was in steep contango. In this situation, future months trade at a premium to the spot price and the nearby contract. In essence, this was a long squeeze, as trapped longs dashed to the exits to get out of their positions. When it was all said and done, the May contract settled at $10.01, up $47.64 from Monday. We live in interesting times.
The mismatch between supply and demand is not going to end anytime soon. OPEC+ does plan to cut output by 9.7 million barrels/day in May and June, but the coronavirus-inflicted demand destruction is much higher. In the U.S, stocks continue to build.
For the week of April 17, as per the EIA, crude stocks increased 15 million barrels to 518.6 million barrels, which was the highest since May 2017. Gasoline and distillate stocks were 263.2 million barrels and 136.9 million barrels – respectively up one million barrels and 7.9 million barrels. Gasoline stocks are at a new high. Refinery utilization dropped 1.5 percentage points to 67.6 percent. Crude imports continued to fall, down 743,000 b/d to 4.9 mb/d – the lowest since February 1992. Crude production fell 100,000 b/d to 12.2 mb/d. U.S. production reached record 13.1 mb/d last month, and likely is headed lower in weeks/months to come. As of Friday, the U.S. rig count was 465, down 526 from last year.
After Tuesday’s wild session, WTI produced a spinning top Thursday and a doji Friday. On the weekly, a potentially bullish hammer formed. For upward momentum to build, bulls first need to take out $19-20.
E-mini S&P 500: Currently net short 192.7k, down 25.1k.
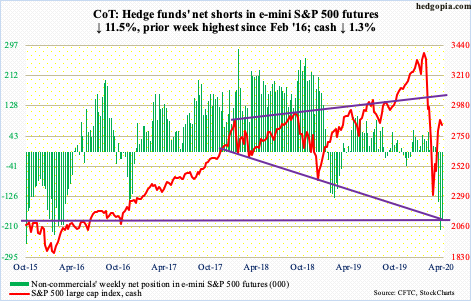
Tuesday, the cash (2836.74) lost a rising trend line from the March 23rd low (more on this here). At one point in that session, the S&P 500 was down 5.1 percent. The drop into 2720s was bought, with the week ending down only 1.3 percent.
Flows continue to be mediocre at best and disappointing at worst. In the week to Wednesday, $1.9 billion moved into U.S.-based equity funds (courtesy of Lipper). In the same week, SPY (SPDR S&P 500 ETF), VOO (Vanguard S&P 500 ETF) and IVV (iShares Core S&P 500 ETF) collectively lost $2.5 billion (courtesy of ETF.com).
Several weekly indicators including the RSI look to be wanting to turn back down from the median. Besides 2720s, nearest support lies at 2630s. That said, should 2850s-70s decisively fall, short squeeze can occur. Non-commercials cut back some this week but hold sizable net shorts.
Euro: Currently net long 87.2k, up 601.
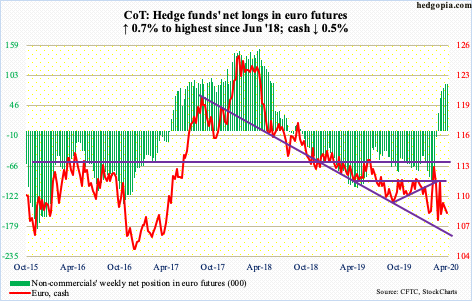
Wednesday, the ECB agreed to accept junk bonds that were investment grade until April 7th to be used as collateral. It is obviously trying to preempt imminent rating downgrades in the months/quarters to come. In the future, it may very well decide to make junk bonds eligible for purchase, like its U.S. peer which ventured into the area two weeks ago.
The cash ($108.21) shed 0.5 percent this week. Thursday, $107.60s was tested and held. A breach could have opened the door to a test of the March 20th low of $106.35.
Gold: Currently net long 249.6k, down 2.9k.
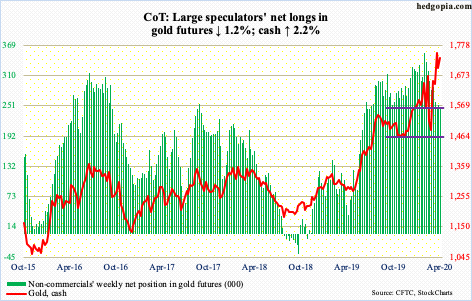
The cash ($1,735.60/ounce) Tuesday undercut $1,700 but $1,670s held. There is stronger support at $1,560s. As long as these levels hold, gold bugs deserve the benefit of the doubt.
Recent weakness followed a peak on the 14th when gold tagged $1,788.80 intraday before retreating. This was met by persistent inflows insofar as IAU (iShares Gold Trust) and GLD (SPDR Gold ETF) are concerned. In the week to Wednesday, they respectively took in $356 million and $1.1 billion. In the past five, they together gained $8 billion.
Nasdaq 100 index (mini): Currently net long 8.7k, up 8.5k.
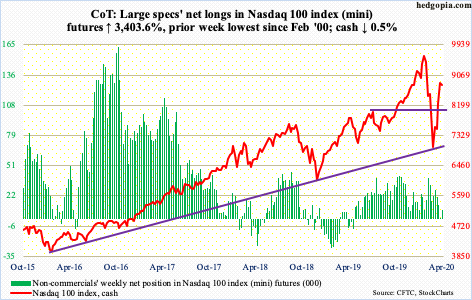
Last Friday, the cash (8786.60) formed a hanging man on the daily chart, followed by a shooting star this Monday. This followed a 19-session, 31-percent surge through last Friday’s intraday print of 8879.24. That high slightly exceeded 61.8-percent retracement of the February 19th-March 23rd collapse. Fibonacci followers tend to closely watch this sequence, also known as the golden ratio.
Tuesday, bulls did step up to defend a rising trend line from the March low. The slightly-falling 50-day (8307.75) lied there as well. Next week, several heavy hitters report – from Microsoft (MSFT) and Facebook (FB) to Amazon (AMZN) and Alphabet (GOOG/L), not to mention Apple (AAPL).
Ahead of this, in the week to Wednesday, QQQ (Invesco QQQ Trust) gained $1.8 billion (courtesy of ETF.com). Friday, Intel’s (INTC) post-earnings weakness was bought, as the stock rallied from down five percent to end the session up 0.4 percent. SMH (VanEck Vectors Semiconductor ETF) this week came close to losing trend-line support from its March low, but not quite. It is bumping up against a broken trend line from December 2018 (more on this here).
Russell 2000 mini-index: Currently net short 28.6k, up 4.6k.
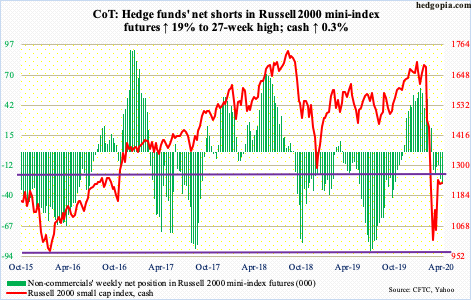
In the week to Wednesday, IWM (iShares Russell 2000 ETF) lost $1.2 billion and IJR (iShares Core S&P Small-Cap ETF) $99 million (courtesy of ETF.com).
From its March low, the cash (1233.05) retraced 38.2 percent of its February-March decline, which lies at 1246. This is about where five-year horizontal resistance at 1250s lies. This is proving to be quite a roadblock to conquer.
That said, small-cap bulls Tuesday did defend 1170s, which represented short-term horizontal support as well as a rising trend line from the March low. Bears are on the back foot, but momentum can go the other way should 1250s fall.
US Dollar Index: Currently net long 15.6k, up 259.
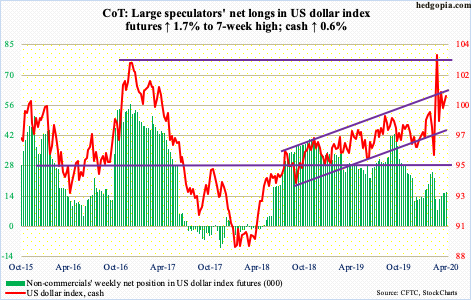
Once again, the cash (100.43) is testing five-year horizontal resistance at 100.50-101. This is also where the upper bound of an ascending channel going back to August 2018 sits. Dollar bulls have been hammering on this for several weeks now. In fact, there was a breakout six weeks ago, but only to get denied in the very next week. A sustained breakout has the potential to reverberate through all sorts of assets, not to mention economies.
VIX: Currently net short 32.2k, down 1.3k.
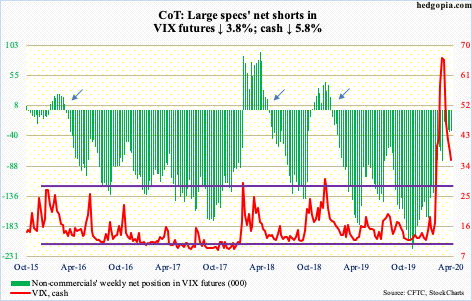
The cash (35.93) this week slightly undercut the March 24th intraday low of 36.24, which was a successful test of the December 2018 high of 36.20. Volatility bulls need to step up right here. A decisive breach opens the door to a test of mid- to high-20s.
Thanks for reading!
