
Following futures positions of non-commercials are as of January 16, 2018.
10-year note: Currently net short 89.3k, down 107.6k.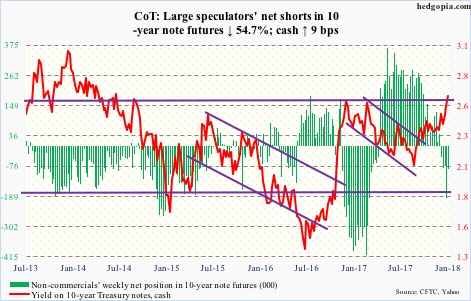
A Bloomberg article last week about China beginning to weigh slowing or halting purchases of U.S. Treasurys gave the bond market the jitters. Already, fixed-income investors/traders – as well as others – were wondering if the three-decade-old bull market in bonds was over. This week, 10-year yields jumped nine basis points to 2.64 percent – just past resistance at 2.62 percent.
At $1.18 trillion, China is the largest holder of Treasury securities. Japan – at $1.08 trillion – is close second. The U.S. Treasury market is $14.2-trillion strong.
China’s holdings peaked in November 2013 at $1.32 trillion, but off the $1.05-trillion bottom in November 2016 these have gone up by $127.3 billion.
Being an export-dependent economy and one that runs a huge trade surplus with the U.S., China needs to recycle those dollars, which it accomplishes through purchases of Treasurys. This interdependence is not going to go away anytime soon.
If there is a risk to the bull market, then it likely comes from U.S. deficit spending.
The U.S. economy is in its ninth year of recovery. On a 12-month rolling total basis, the government is yet to run a budget surplus. The deficit began improving after peaking at minus $1.7 trillion in June 2010. However, since minus $335 billion last July, it has once again been rising, with December at minus $399 billion.
In all probability, this only gets worse. The recently passed tax cuts do not help – means more Treasury issuance.
Thus far, foreigners’ purchases of Treasury bonds and notes have moved hand in hand with issuance of these securities.
That said, since March 2016 when foreigners held $6.29 trillion worth, holdings have more or less gone flat. In November last year, they dropped $6.4 billion from October’s record $6.35 trillion.
Hence the question, will foreigners step up to the plate and buy more as Treasury issuance goes up thanks to higher deficit spending? That is the real risk facing U.S. sovereign bonds.
30-year bond: Currently net long 67.1k, up 364.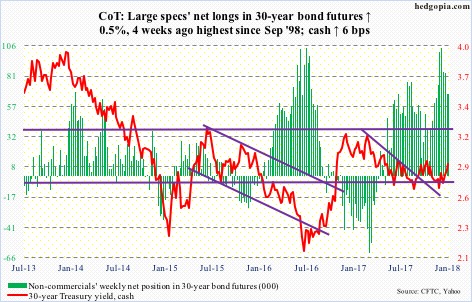
Major economic releases next week are as follows.
Existing home sales for December are due out Wednesday. Sales in November jumped 5.6 percent month-over-month to a seasonally adjusted annual rate of 5.81 million units. This was the highest since 6.42 million in December 2006.
Thursday has December’s new home sales on tap. November surged 17.5 percent m/m to 733,000 units (SAAR) – the highest since 778,000 in July 2007.
Friday brings durable goods orders (December) and GDP (4Q17, preliminary).
November orders for non-defense capital goods ex-aircraft – proxy for business capital expenditures – rose eight percent year-over-year to $67.1 billion (SAAR). They fell 0.2 percent m/m. Orders peaked in September 2014 at $70.3 billion and have been rising since bottoming in May 2016 at $59.9 billion.
As of January 18, the Atlanta Fed’s GDPNow model was forecasting 3.4-percent growth in real GDP (SAAR) in 4Q. This follows growth of 3.2 percent and 3.1 percent in 3Q and 2Q, respectively. If 4Q prints three percent or higher, this would be the first time since 2Q04-1Q05 of at least three consecutive quarterly growth of three percent or higher.
Crude oil: Currently net long 786.5k, up 54.1k.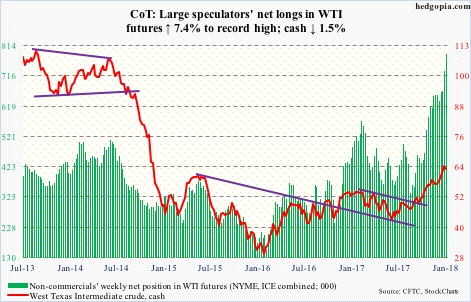
Spot West Texas Intermediate crude ($63.31/barrel) is itching to go lower. It has had quite a ride – up 42-plus percent from the August 31st low last year through Tuesday’s three-plus-year high.
Nearest support lies at $62, followed by $59. The latter also approximates the 50-day moving average.
Non-commercials are the most long ever, and pose a risk once they decide to lock in profit.
The EIA report for the week of January 12 was not much help to the bulls.
Crude and distillate stocks fell – respectively down 6.9 million barrels and 3.9 million barrels to 412.7 million barrels and 139.2 million barrels. Crude stocks were the lowest since February 2015.
Gasoline stocks, however, rose 3.6 million barrels to 240.9 million barrels – a 29-week high.
As did U.S. crude production and imports. The former increased 258,000 barrels per day to 9.75 million b/d, and the latter 292,000 b/d to 7.95 mb/d.
Refinery utilization fell 2.3 percentage points to 93 percent. The 96.7-percent reading two weeks ago was the highest since August 2005.
E-mini S&P 500: Currently net long 122.5k, up 45k.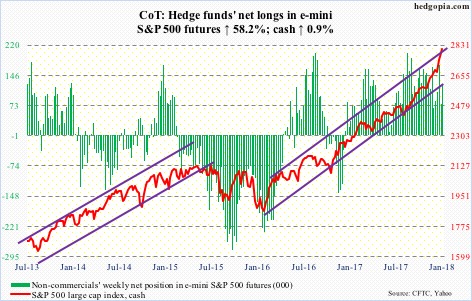
Tuesday saw the cash (2810.30) gap up to a new all-time high but only to close in the red. There was no confirmation of the potentially bearish action in the subsequent sessions, but the next two sessions were inside days, which, until proven otherwise, can both be a continuation or reversal pattern.
The weekly chart has developed a potentially bearish hanging man.
In the meantime, the sell-side sharply revised 2018 earnings estimates higher, and in the week through Wednesday, U.S.-based equity funds (including ETFs) took in another $9.1 billion. This followed inflows of $12 billion in the prior week (courtesy of Lipper).
In the same week, $4.7 billion went into SPY (SPDR S&P 500 ETF), while VOO (Vanguard S&P 500 ETF) and IVV (iShares core S&P 500 ETF) attracted $255 million and $236 million, in that order (courtesy of ETF.com).
Euro: Currently net long 139.5k, down 5.2k.
Vitor Constancio, VP, ECB, warns the euro is getting ahead of itself.
In a little over a year, the cash ($122.23) has rallied nearly 19 percent. Will Mario Draghi, ECB president, also try to talk the currency down next week?
More importantly, traders must be wondering if the bank would wind down its ongoing QE come September.
For now, the currency did not pay much attention to Mr. Constancio’s verbal intervention.
Nonetheless, signs of fatigue are showing up. Wednesday produced a shooting star with a very long wick, followed by a long-legged doji Thursday.
Breakout retest takes place at $120.50-ish. If lost, that could potentially put non-commercials under pressure to unwind at least some of their near-record net longs.
Gold: Currently net long 211.7k, up 8.4k.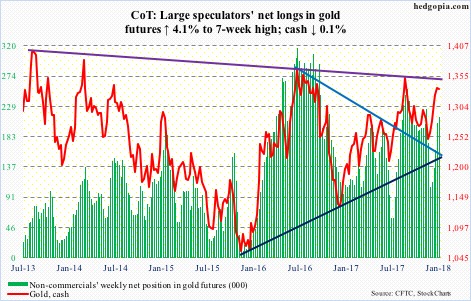
The cash ($1,333.10/ounce) Tuesday rose to $1,345 intraday to just about test a falling trend line from July 2016, and was rejected. That was a long-legged-doji session, as were the next two sessions.
The metal looks tired, having gone up a little under nine percent in five weeks. If gold bugs are unable to save the 10-day ($1,326.97), a little giveback is natural. Crucial test lies at $1,300, which gold broke out of late December last year after several tries.
In the week to Wednesday, IAU (iShares gold trust) took in $102 million, while GLD (SPDR gold ETF) saw no activity (courtesy of ETF.com).
Nasdaq 100 index (mini): Currently net long 25.4k, up 9.2k.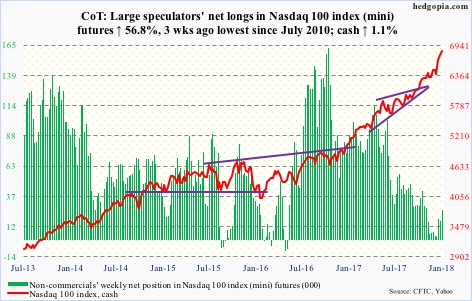
Tuesday’s action on the cash (6834.33) was potentially a dark cloud cover, but there was no confirmation.
For now, the bears continue to struggle to make a dent in the prevailing bullish momentum.
For whatever it is worth, the monthly RSI (14) on the Nasdaq 100 currently stands at 84.52 – the highest since March 2000.
Unlike in the prior week when QQQ (PowerShares QQQ ETF) gained $1.8 billion, in the week through Wednesday it lost $424 million (courtesy of ETF.com).
Russell 2000 mini-index: Currently net long 41.9k, up 6.5k.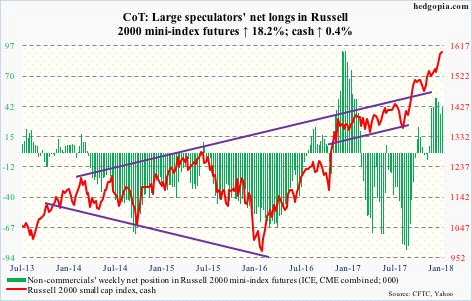
Of major U.S. equity indices, small-caps act the weakest. The cash was only up 0.4 percent for the week. That said, the bulls did manage to defend the 10-day on Friday.
Ahead of this, in the week to Wednesday, $305 million moved into IWM (iShares Russell 2000 ETF). IJR (iShares core S&P small-cap ETF) took in another $87 million (courtesy of ETF.com).
US Dollar Index: Currently net short 1.3k, down 2.1k.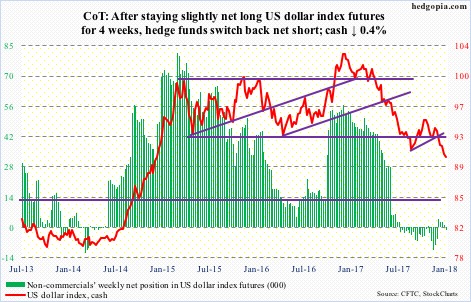
The cash (90.37) dipped under 90 – to 89.96 on Wednesday (and matched on Friday) – before finding its feet. Even if this is a bottom – likely – the dollar index needs to stabilize.
The daily lower Bollinger band continues to drop, as do shorter-term moving averages.
Non-commercials once again switched to net short, albeit only slightly.
Nearest resistance lies at 91, and then 91.50.
Worse, it drops to test support at 89.
VIX: Currently net short 82.2k, down 9.5k.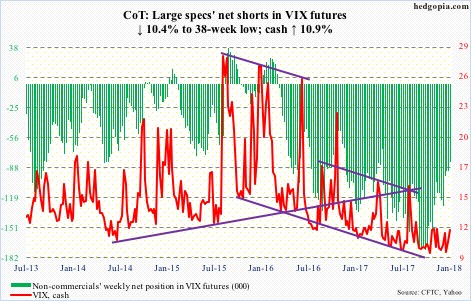
For the second week running, both the cash (11.27) and the S&P 500 rallied. This ordinarily does not happen.
Perhaps encouragingly for volatility bulls, VIX has remained above the 200-day – and the 50-day – for four sessions now.
That said, in 10 sessions VIX rallied just under four points to Wednesday’s high of 12.81. This, even as the S&P 500 rallied three-plus percent.
Thus the need for vol bulls to also be on the lookout for a spike reversal. In the past, such reversals led to quick unwinding of the daily overbought condition, which VIX is in currently.
Thanks for reading!
