
Following futures positions of non-commercials are as of February 6, 2018.
10-year note: Currently net short 327.5k, up 111.9k.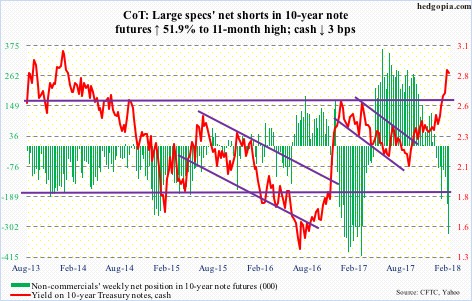
The bond market is worried.
Yes, beginning last October the Fed has been curtailing its bloated $4.5-trillion balance sheet. Yes, foreigners’ holdings of Treasury securities – at $6.34 trillion last November – have essentially gone sideways since March 2016.
But why the sudden spike in 10- and 30-year Treasury yields?
Most recently, 10-year yields bottomed at 2.03 percent on September 7 last year. Intraday Thursday, they rose to 2.88 percent. The Tax Cuts and Jobs Act of 2017 was signed into law on December 22. These tax cuts will only exacerbate the already bad fiscal situation.
On a 12-month running total basis, the federal budget deficit last November totaled $684.9 billion, up from $403.6 billion in January 2016. On the same basis, issuance of Treasury notes and bonds totaled $422 billion in January, and has crept higher since $335 billion last July. They are both headed higher, and bond vigilantes are worried – rightly or wrongly, we will find out in due course – if demand would be sufficient to meet the new supply.
For now, having rallied as much as they have in recent weeks/months, 10-year yields (2.83 percent) are sending out signs that they are in a process of peaking. This week saw two back-to-back long-legged dojis on Thursday and Friday.
30-year bond: Currently net long 23.1k, down 30.3k.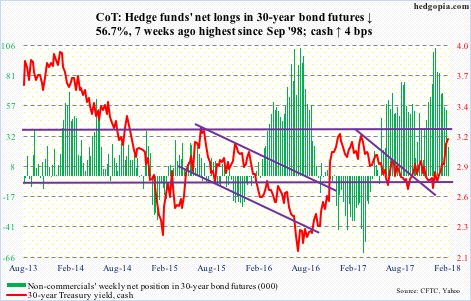
Major economic releases next week are as follows.
The NFIB small business optimism index for January comes out Tuesday. December was down 2.6 points from November’s 107.5, which was the highest since 1983.
CPI (January) and retail sales (January) are scheduled for Wednesday.
Consumer prices rose 0.1 percent month-over-month in December and 2.1 percent in the 12 months to December. Over the same time period, core CPI increased 0.3 percent and 1.8 percent, respectively.
Retail sales in December rose 5.5 percent year-over-year to a seasonally adjusted annual rate of $495.4 billion.
On Thursday, PPI-FD (January), industrial production (January), the NAHB housing market index (February) and Treasury International Capital data (December) are on deck.
Producer prices fell 0.1 percent m/m in December. Core PPI edged up 0.1 percent in that month. In the 12 months to December, they respectively rose 2.6 percent and 2.3 percent.
December’s capacity utilization rose 2.4 percent y/y to 77.9 percent.
Builder sentiment fell two points m/m in January from December’s 74, which was the highest since 75 in July 1999.
In the first 11 months last year, foreigners gobbled up $91.4 billion in U.S. stocks and $35.9 billion in U.S. Treasury bonds and notes.
Friday brings housing starts (January) and the University of Michigan’s consumer sentiment index (February, preliminary).
Starts fell 8.2 percent m/m in December to 1.19 million units (SAAR).
Consumer sentiment in January fell two-tenths of a point m/m to 95.7. Last October’s 100.7 was the highest since 103.8 in January 2004.
Crude oil: Currently net long 790.7k, up 2.1k.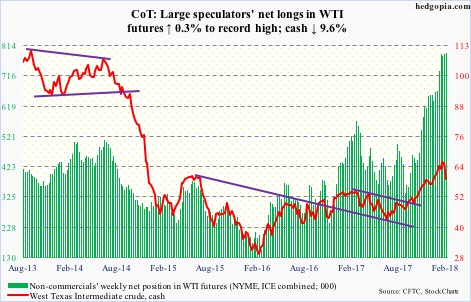
Spot West Texas Intermediate crude ($59.20/barrel) came under pressure since peaking at $66.66 on January 25. The week opened down, with the crude losing both 10- and 20-day moving averages on Monday. Wednesday’s EIA report for the week ended February 2 did not help.
U.S. crude production jumped 332,000 barrels per day to north of 10 million b/d – 10.3 mb/d, to be exact.
Crude stocks jumped 1.9 million barrels to 420.3 million barrels. Gasoline and distillate stocks rose as well – up 3.4 million barrels and 3.9 million barrels to 245.5 million barrels and 141.8 million barrels, respectively.
Crude imports, however, fell 538,000 b/d to 7.9 mb/d.
Refinery utilization jumped 4.4 percentage points to 92.5 percent.
Friday, the crude lost the 50-day, but buyers did show up near support at $58-59. In a worse-case scenario near term, it goes on to retest October 2017 breakout at $55.
E-mini S&P 500: Currently net long 286.2k, up 113.4k.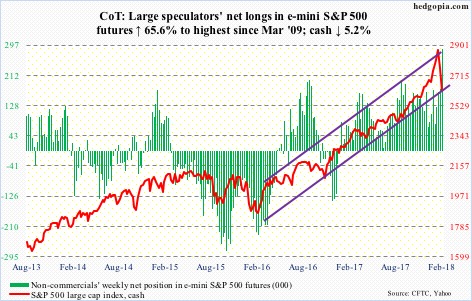
From the January 26th intraday high of 2872.87 through Friday’s low of 2532.69, the cash shed 11.8 percent. That is in 11 sessions! The speed by which stocks have been sold has to be raising concerns in the intermediate term.
Near-term, there will be a bounce/rally. Buyers showed up at the 200-day Friday.
Thursday, only 13.6 percent of S&P 500 stocks were above their 50-day. This compares with nine percent in February 2016, and 4.6 percent in August 2015.
What kind of a bounce and with with vigor will depend a lot on if there is any buying power left.
Non-commercials are net long up to the gills, having aggressively added this week.
January saw record inflows in ETF’s. SPY (SPDR S&P 500 ETF), VOO (Vanguard S&P 500 ETF) and IVV (iShares core S&P 500 ETF) alone took in $28.5 billion in that month (courtesy of ETF.com). Some of this optimism is being tempered. In the week to Wednesday, SPY and VOO respectively lost $17.3 billion and $364 million, while $2.7 billion moved into IVV.
During the same week, U.S.-based equity funds (including ETFs) lost $23.9 billion. This follows inflows of $60.7 billion in the prior four (courtesy of Lipper).
Euro: Currently net long 140.8k, down 7.9k.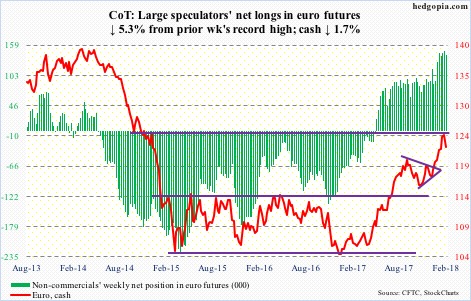
After two consecutive weeks of unsuccessfully attempting to break out of $125, the bulls gave up this week. Two weeks ago, the cash ($122.52) retreated after hitting $125.37. A falling trend line from the all-time high of $160.20 in April 2008 lies there. This level also represents measured-move-target resistance of a 10-point range breakout last July.
There is support at $120-121. The 50-day rests at $120.63.
Non-commercials are heavily net long, and have for a while provided a tailwind to the cash. When they decide to lock in profit, this turns into a headwind.
Gold: Currently net long 190.9k, down 16.4k.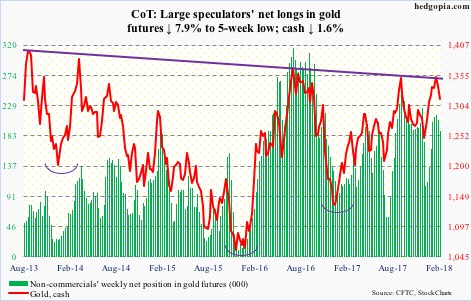
Stocks took it on the chin the past couple of weeks, but gold did not quite benefit from its safe-haven status. This was probably because of the heavy resistance the cash ($1,315.70/ounce) faced.
Gold got rejected at a slightly falling trend line from August 2013. This level also approximates the neckline of a reverse-head-and-shoulders formation. Then there is Fibonacci resistance. The yellow metal peaked in September 2011 at $1,923.70, then bottoming at $1,045.40 in December 2015. A 38.2-percent retracement of this decline lies at $1,380.91. Three weeks ago, it rallied to $1,365.40.
A breakout would be massive. There is support at $1,300. The 50-day ($1,304.62) lies there as well. Gold bugs need flows to improve.
In the week through Wednesday, IAU (iShares gold trust) attracted $70 million, but GLD (SPDR gold ETF) lost a hefty $607 million (courtesy of ETF.com).
Nasdaq 100 index (mini): Currently net long 12.5k, down 9.9k.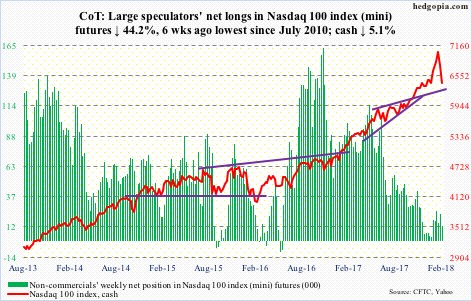
Several weekly indicators on the cash (6412.68) are approaching the median. This is as good a place as any for the bulls to put their foot down. Else, the weekly chart continues to unwind.
Thursday, merely 22.5 percent of Nasdaq stocks were above their 50-day. Back in October 2016, this metric bottomed at 22.8 percent. However, it dropped all the way to 8.2 percent in January 2016. Hence the need for things not to continue to unravel. Friday’s reversal higher from just above the 200-day is encouraging.
QQQ (PowerShares QQQ ETF) in the week through Wednesday took in $127 million (courtesy of ETF.com).
Russell 2000 mini-index: Currently net long 13.5k, down 25.7k.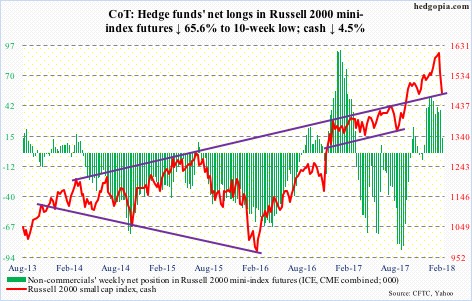
Of the major U.S. equity indices, the cash (1477.84) was the first one to test the 200-day. After a successful test Tuesday, the average was tested again Thursday, and then again on Friday. Near term, there is resistance at 1515 on the way up.
In the week to Wednesday, IWM (iShares Russell 2000 ETF) bled $896 million, and IJR (iShares core S&P small-cap ETF) $10 million (courtesy of ETF.com).
US Dollar Index: Currently net short 3.6k, down 2.2k.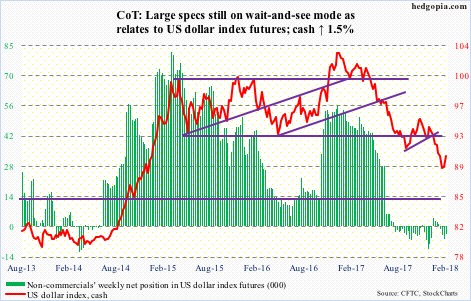
The cash (90.33) firmed up this week, but concurrently in a long-legged-doji session Thursday faced resistance at broken-support-turned-resistance at 90.50. It remains above both 10- and 20-day, which can act as support for dollar bulls to step up and defend.
Importantly, they have defended support at 88-89, which goes back to early 2004. The intraday low of 88.25 on January 25 also tested a rising trend line from May 2011. As long as that low is not violated, the path of least resistance is up.
VIX: Currently net long 85.8k, up 145.2k.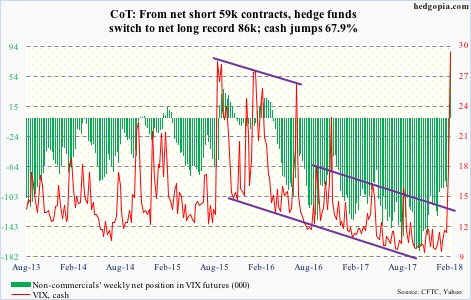
Tuesday, the cash (29.06) surged intraday to 50.30 – the highest since 53.29 on August 24, 2015 – but closed at 29.98. This is a spike reversal. In the past, post-reversals, VIX goes on to unwind the kind of daily overbought condition that it currently finds itself in.
Non-commercials switched to most net long ever. If past is prologue, this gradually gets unwound, pushing the cash lower. On a related note, the demise of VelocityShares Daily Inverse VIX Short Term ETN (XIV) may help VIX normalize. That said, it is very possible volatility has entered a higher regime. We may not see 10 for a while.
Thanks for reading!
