
Following futures positions of non-commercials are as of May 29, 2018.
10-year note: Currently net short 471.1k, up 112.4k.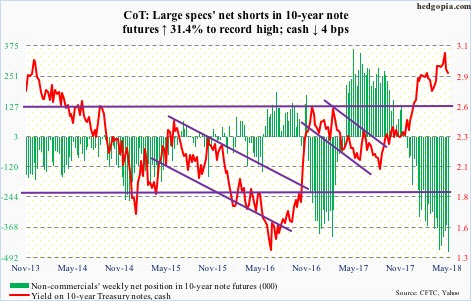
“When the pendulum swings too far in one direction it will go back,” Supreme Court Justice Ruth Bader Ginsburg once said. In the investment world, we saw this phenomenon unfold in the past couple of weeks in the US sovereign bond market. Kind of.
In the eight sessions ended Tuesday, the 10-year Treasury rate shed 36 basis points to 2.76 percent. TLT (iShares 20+ year Treasury bond ETF) shot up 5.5 percent during the period, before backing off. Friday, yields closed at 2.9 percent.
The latest downward pressure on 10-year yields preceded a massive rally. Last September, the 10-year yielded 2.03 percent, then rising to 3.12 percent by May 17, which was the highest since July 2011.
As yields kept rising – first past resistance at 2.62 percent, then out of a three-decade-old descending channel, and then three percent – the crowd was convinced the rally was just getting started. From September 7 last year through Thursday this week, TLT lost $602 million (courtesy of ETF.com). Non-commercials of course were heavily net short.
Speaking of which, these traders used the latest drop in yields to aggressively add to their net shorts – now a new record. Is this a case of this pendulum swinging too far in one direction? Time will tell. This much we know. Bond bears would not want to see 10-year yields’ monthly chart begin to dominate. Monthly momentum indicators are beginning to turn lower, and have room to go a lot lower. If this scenario unfolds, potential short squeeze can only add fuel to the fire.
30-year bond: Currently net short 33.7k, up 28.4k.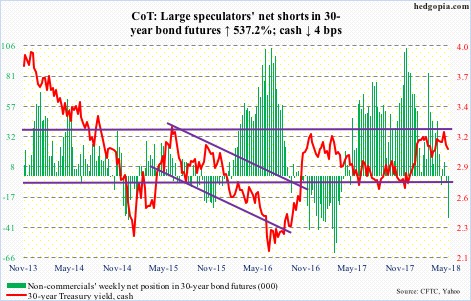
Major economic releases next week are as follows.
April’s revised durable goods orders, plus non-durable goods data, are due out Monday. Preliminarily, April orders for non-defense capital goods ex-aircraft – proxy for business capex plans – rose 5.9 percent year-over-year. Growth is healthy but has been decelerating since growing 13.3 percent last September.
The ISM non-manufacturing index (May) and JOLTS (April) are scheduled for Tuesday.
Services activity in April dropped two points month-over-month to 56.8. January’s 59.9 was the highest ever (data only goes back to January 2008).
Non-farm job openings shot up 472,000 m/m in March to 6.55 million – a new record.
Wednesday brings revised productivity data for 1Q18. Preliminarily, non-farm output per hour rose 1.3 percent y/y in the quarter. Productivity remains suppressed. The last time it increased with a two handle was in 3Q10.
Crude oil: Currently net long 682.8k, down 41.9k.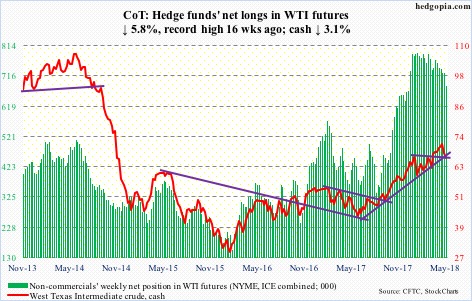
After last week’s 4.9-percent rout in spot West Texas Intermediate crude ($65.81/barrel), oil bulls were probably hoping the weekly EIA report would help stop the bleeding this week. The report for the week ended May 25 was mixed at best. The crude lost another 3.1 percent this week.
US crude stocks fell 3.6 million barrels to 434.5 million barrels. Crude imports declined 528,000 barrels per day to 7.63 million b/d. And refinery utilization rose 2.1 percentage points to 93.9 percent, a 20-week high.
Crude production, however, continued its uptrend, rising 44,000 b/d to 10.77 mb/d. Gasoline stocks rose, too, up 534,000 barrels to 234.4 million barrels. Ditto with distillates, which increased 634,000 barrels to 114.6 million barrels.
Spot WTI began the week by losing the 50-day ($67.78). Support at $66.50-ish was also lost. The sooner the bulls recapture the latter, the better. Inability to do so likely opens the door toward $63, which is where a trend line drawn from last June lies.
Medium- to long-term, WTI probably has more to go on the downside. Non-commercials have been cutting back but are still heavily net long. They have ridden the rally in oil well, having begun to aggressively build net longs last September. The urge to lock in profit rises as crude momentum fades. Last week’s bearish engulfing candle on the cash may have set in motion that process.
E-mini S&P 500: Currently net long 124.1k, down 61.2k.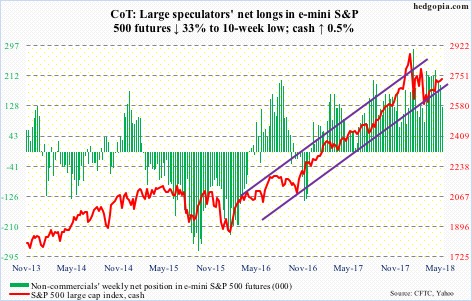
It is like pouring water into sand. In the week through Wednesday, US-based equity funds (including ETFs) gained another $4.9 billion. This followed inflows of $13.8 billion in the prior two weeks (courtesy of Lipper.com). The cash (2734.62) was up 0.5 percent for the whole week, but was flat through Wednesday.
Also in the week to Wednesday, combined flows into S&P 500-focused ETFs were positive, with SPY (SPDR S&P 500 ETF) losing $470 million, but VOO (Vanguard S&P 500 ETF) and IVV (iShares core S&P 500 ETF) attracting $551 million and $318 million, in that order (courtesy of ETF.com).
The S&P 500 began the holiday-shortened week by dropping out of a three-week box, but bids showed up at the 50-day moving average. By the end of the week, it rallied back into the box. Bulls continue to struggle to build on trend-line breakout of three weeks ago.
Euro: Currently net long 93k, down 16.7k.
Last July, the cash ($116.65) broke out of $114-115. This preceded two-plus-year consolidation within a rectangle. It was an important breakout. This week, there was a successful retest, as the euro drew bids after dropping intraday to $115.19 on Tuesday.
Between an intraday high of $125.37 on January 25 and this week’s low, the euro already dropped 8.1 percent. The weakness emanating from political developments in Italy has been bought. Both the daily and weekly charts are severely oversold. Odds favor at least some of this gets unwound near term.
Gold: Currently net long 115.1k, up 24.2k.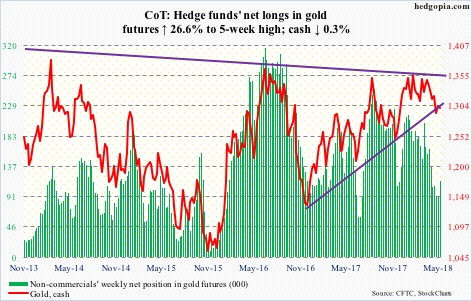
GLD (SPDR gold ETF) and IAU (iShares gold trust) continued to experience withdrawals, respectively losing $25 million and $188 million in the week to Wednesday (courtesy of ETF.com). If there is a silver lining in this, it is that the cash ($1,299.30/ounce) hung in there despite these outflows. Plus, non-commercials added to their net longs.
The problem for gold bugs is that they continued to face resistance at the broken-support-turned resistance of $1,300-plus. Thursday, the metal rallied to $1,311.50 intraday before sellers appeared. With all that said, having defended last week support at $1,280s, which represents a rising trend line from December 2016, they deserve the benefit of the doubt. The week produced a long-legged doji.
Nasdaq 100 index (mini): Currently net long 6.4k, up 10.1k.
For the last four weeks, the cash (7083.93) traded within a rectangle. There was also an ascending triangle in play. Friday, post-May jobs report, the Nasdaq 100 broke out. It is still 1.4 percent from its March all-time high, but a test looks likely.
Non-commercials are betting on this outcome. Ditto with flows.
In the week through Wednesday, QQQ (PowerShares QQQ ETF) took in another $1.1 billion. This was the fifth straight week of inflows, during which $3.4 billion came in (courtesy of ETF.com).
Russell 2000 mini-index: Currently net long 74.2k, up 9.1k.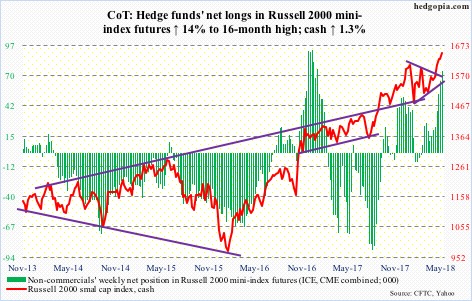
Of major US equity indices, the Russell 2000 is the only one to have rallied to a new high after the late-January/early-February decline. From risk-taking perspective, this can be taken as bullish. But at the same time high-yield corporate bonds are severely lagging; risk appetite for these bonds has been on the wane for a while (more here).
Amidst this, the breakout of two weeks ago on the cash (1647.98) was once again defended this week. Non-commercials further added to net longs, although ETF flows were a little shaky.
In the week ended Wednesday, $49 million came out of IWM (iShares Russell 2000 ETF), while IJR (iShares core S&P small-cap ETF) gained $198 million (courtesy of ETF.com).
US Dollar Index: Currently net long 3.9k, up 1.3k.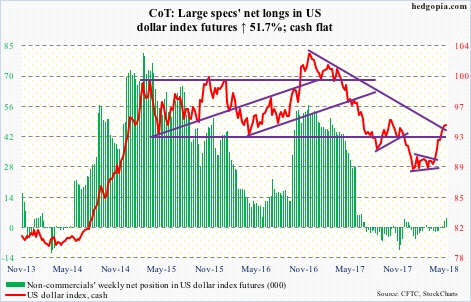
Between early last year and February this year, the cash (94.17) dropped from 103.82 to 88.15. A 38.2-percent retracement of this decline lies at 94.14, and a 61.8-percent retracement at 101.74. Is this where the US dollar index is headed eventually? Tough to say, but it retreated after rallying to 94.97 Tuesday. On the daily chart, it has remained overbought for over a month. Unwinding is overdue near term.
VIX: Currently net short 44.4k, up 18.8k.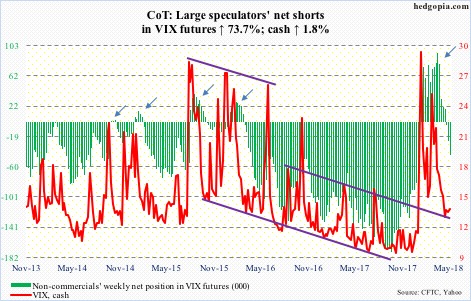
The 21-day moving average of the CBOE equity-only put-to-call ratio dipped further Friday to .597. Optimism among equity investors/traders is elevated. In the past, it has paid off to play contrarian when these readings drop to high .50s-low .60s.
This is probably why volatility bulls came out in force Tuesday in response to developments in Italy, rallying the cash (13.46) to 18.78 intraday. This was too far, too fast. In the subsequent sessions, VIX lost north of five points. The daily chart can come under pressure near term.
Thanks for reading!
