
Following futures positions of non-commercials are as of June 12, 2018.
10-year note: Currently net short 336k, down 61.6k.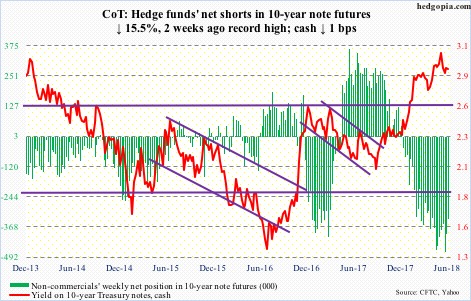
With this week’s 25-basis-point raise, the fed funds rate now stands at 175-200 basis points, up 175 basis points since December 2015. Currently, the futures market is pricing in 85-percent odds of another 25-basis-point hike in September, with December at 53 percent. Even if rates were to go up 50 basis points in the remaining four meetings this year, they would still be very accommodative, given the US economy is two weeks from completing nine years of recovery.
Of the three major central banks, the Fed is the only one raising rates. It tilted slightly more hawkish this week. The ECB and the BoJ are both standing pat. But as relates to the unconventional monetary tool that central banks heavily relied on post-financial crisis, the picture is beginning to change. After the crisis, these banks, and others such as the BoE, heavily deployed QE.
In November 2008, when the Fed began its first iteration of QE, its SOMA holdings were just south of $500 billion. By April 2017, they had ballooned to $4.24 trillion. This Wednesday, they were just south of $4.1 trillion. In October 2014, the Fed stopped its QE, in the sense that it was no longer buying bonds, only reinvesting proceeds of maturing assets.
In Japan, the BoJ used a policy tool termed quantitative easing as far back as the early 2000s. Post-Abenomics, in April 2013, when it held ¥175 trillion in assets, the bank expanded its asset-purchase program by ¥60-70 trillion/year, which was expanded to ¥80 trillion in October 2014. In May this year, its balance sheet boasted ¥541 trillion in assets. In April, Haruhiko Kuroda, BoJ governor, testified to the Japanese parliament that there were internal discussions on how to begin to withdraw from bond buying, even though on Friday the bank said it will continue to buy bonds at the current pace.
Similarly, in September 2014, the ECB’s assets were €2.04 trillion. By May this year, this had surged to €4.57 trillion. Here is the thing, though. The bank began tapering in April last year, cutting its monthly asset purchases from €80 billion to €60 billion, and then again to €30 billion this January. Thursday, the ECB said it would wind down the program in December, although it tried to cushion the blow by promising to keep rates unchanged at least through the summer of 2019.
The bottom line: central banks are pulling back. The pace is glacial, but the QE juice is drying up. In due course, this is bound to reverberate through assets, not the least of which are equities.
30-year bond: Currently net long 4.2k, up 22.4k.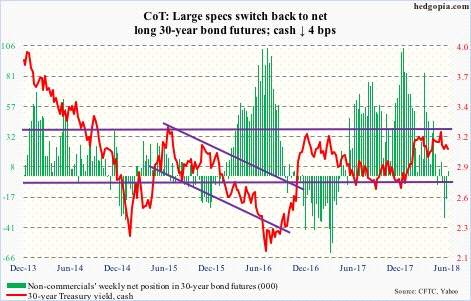
Major economic releases next week are as follows.
Monday brings the NAHB housing market index for June. Builder sentiment in May was up two points month-over-month to 70. Last December’s 74 was the highest since 75 in July 1999.
Housing starts for May are due out Tuesday. In April, starts fell 3.7 percent m/m to a seasonally adjusted annual rate of 1.29 million units. March was a cycle high 1.34 million units, which was the highest since 1.35 million in July 2007.
May’s existing home sales come out Wednesday. April was down 2.5 percent m/m to 5.46 million units (SAAR). Last November’s 5.72 million was the highest since 5.79 million in February 2007.
Crude oil: Currently net long 671.1k, down 3.9k.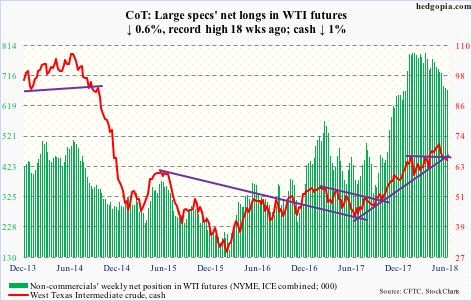
West Texas Intermediate crude ($65.06/barrel) lost trend-line support from last June. If it ends up losing the intraday low of $64.22 nine sessions ago, oil bulls will have tough task at hand. They were dealt a good hand by Wednesday’s EIA report (for the week ended June 8), which they initially used to their advantage, but Friday’s 2.7-percent drop changed the technical picture.
US stocks fell across the board, with crude down 4.1 million barrels to 432.4 million barrels, gasoline down 2.3 million barrels to 236.8 million barrels, and distillate down 2.1 million barrels to 114.7 million barrels.
Crude imports dropped 247,000 barrels/day to 8.01 million b/d.
Refinery utilization inched up three-tenths of a percentage point to 95.7 percent. This was a 23-week high.
Crude production, however, continued to rise, up 100,000 b/d to 10.9 mb/d.
E-mini S&P 500: Currently net long 169.4k, up 7.3k.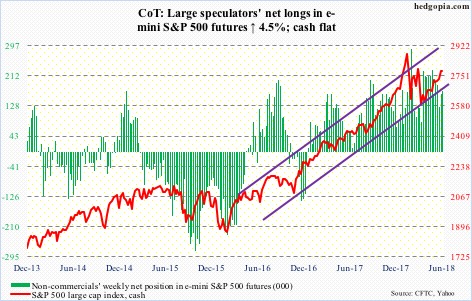
Flows continued to be negative. ETF.com shows a combined $4.1 billion left three S&P 500-focused ETFs in the week to Wednesday – $482 million from SPY (SPDR S&P 500 ETF), $2.8 billion from IVV (iShares core S&P 500 ETF) and $771 million from VOO (Vanguard S&P 500 ETF).
In the same week, US-based equity funds (including ETFs) lost another $9.7 billion (courtesy of Lipper.com).
The cash (2779.66) struggled to build on last week’s three-week rectangle breakout. The daily chart is overbought, and looks fatigued. In the past five sessions, there have been one shooting star, two dojis and one hanging man. The week produced a doji as well.
Euro: Currently net long 88.2k, down 1k.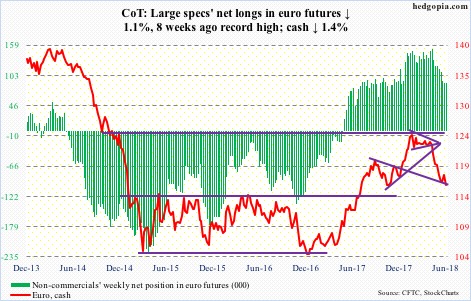
Mario Draghi, ECB president, must be pleased with how markets reacted to Thursday’s policy decision. The cash ($116.17) collapsed 1.9 percent in that session. The daily chart has room to go lower.
Support at $114-115 is crucial. Euro bulls cannot afford to lose this. On May 29, the currency fell to $115.19 intraday before drawing bids.
Gold: Currently net long 120.2k, up 8.8k.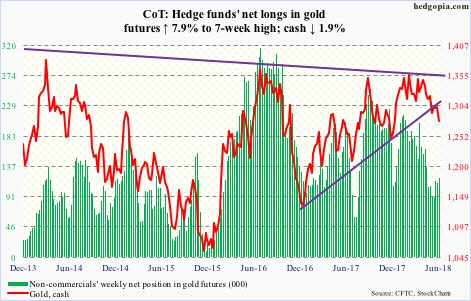
In the week through Wednesday, GLD (SPDR gold ETF) lost $160 million and IAU (iShares gold trust) $206 million (courtesy of ETF.com). In the prior six, the two lost a combined $1.8 billion.
Gold bugs absorbed this selling well – until Friday when the cash ($1,278.50/ounce) collapsed 2.3 percent. With this, trend-line support from December 2016 is now gone. Similar support from November 2015 lies around $1,250.
Nasdaq 100 index (mini): Currently net long 8.4k, down 2.7k.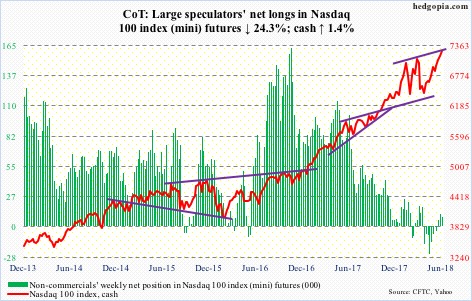
Yet another new high on the cash (7255.76). It has been a relentless push higher since late April, particularly so since breaking out of a short-term box two weeks ago. As overbought as the index is, shorter-term moving averages are still rising.
Since early February, the Nasdaq 100 has made higher lows, and also higher highs. The upper bound of this ascending channel is being tested. Bears have an opportunity, if they can cash in.
Some level of hesitancy can be detected in flows, but this has thus far not mattered much. In the week ended Wednesday, QQQ (PowerShares QQQ ETF) lost $1.5 billion. This followed outflows of $752 million in the prior week.
Russell 2000 mini-index: Currently net long 68.6k, down 2.3k.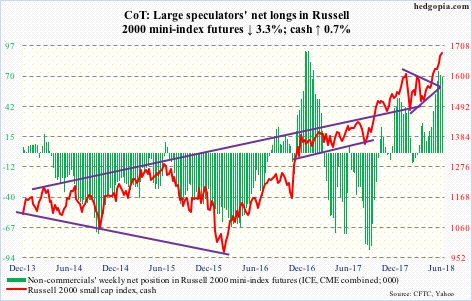
The cash (1683.91) continued to trudge higher, yet in the options market some interesting action was noticed in RVX (CBOE Russell 2000 volatility index). Wednesday, it dropped to an all-time low 10.32 before ending the session with a massive hammer reversal. Tuesday, too, produced a hammer candle. For small-cap bears to be able to make something out of this, they need to first wrest momentum away from the bulls.
In the week to Wednesday, $885 million did come out of IWM (iShares Russell 2000 ETF), while IJR (iShares core S&P small-cap ETF) took in $209 million (courtesy of ETF.com).
If the Russell 2000 were to come under pressure, there is decent support around 1610.
US Dollar Index: Currently net long 4.7k, up 249.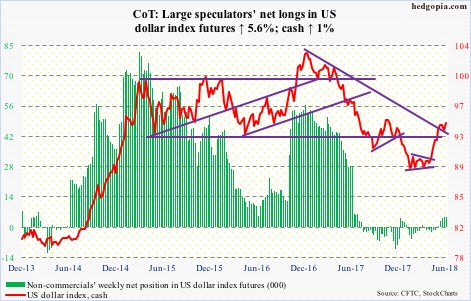
The euro’s loss was the dollar’s gain Thursday. The cash (94.45) in that session saw a huge engulfing candle as it reversed early loss to rally 0.8 percent. It is now a stone’s throw away from the intraday high of 94.97 from May 29, which was the highest since November 2017.
For whatever it is worth, the US dollar index just completed a golden cross. Concurrently, traders treated the Fed’s hawkish tilt on Wednesday with pretty much a yawn. So what happens around the late-May high will be telling.
VIX: Currently net short 53.3k, up 17.2k.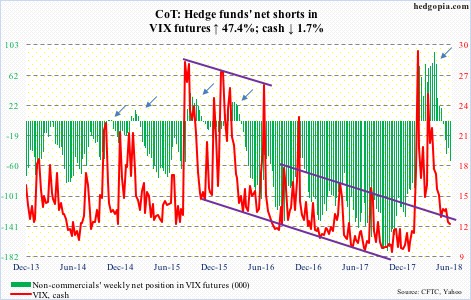
In the last four sessions, the cash (11.98) was pushed sub-12 intraday. Volatility remains suppressed. No question about it. This is what equity bulls are currently feeding on. The question is, how long before VIX begins to unwind oversold conditions? Likely soon, if signals coming from the options market are any indication.
In 10 of last 13 sessions, the CBOE equity-only put-to-call ratio registered readings of .50s or lower. The 21-day moving average of the ratio Thursday dropped to .569. For reference, prior to the late-January peak in US equities, the ratio bottomed at .543 on the 26th. This metric is beginning to get way stretched.
Thanks for reading!
