The following are futures positions of non-commercials as of May 12, 2015. Change is week-over-week.
10-year note: If we just focus on weekly closing prices, the 10-year yield had a lackluster week – essentially flat. Nothing could be further from the truth. From intra-day low to high, it swung 20 basis points. Last week, the range was 17 basis points. May is reminding us of October last year, in which the yield swung between 1.87 percent and 2.17 percent in a single day.
All of a sudden, Treasurys on the long end are acting jittery. Early in the week, they got slammed even though U.S. inflation and growth outlook remained subdued. It is possible the sell-off in German bunds influenced trader behavior (herd mentality). Or just the fact that there is a lack of liquidity, both here and abroad. How willing are long-term holders such as insurance companies to lend their bonds these days?
There was a time mid-week when the 10-year yield broke out of its December 2013 downward sloping trendline, but could not hold on to it. Data simply was not cooperating. From retail sales to industrial production to consumer sentiment, they all came in weaker than expected. The only shining light was the weekly unemployment claims, but one wonders if this series is at an inflection point (more here).
It is possible non-commercials covered some of their shorts. Monday, the 10-year shot up 12 basis points, followed by another six-basis-point rise the next day, before giving it all back and then some.
Currently net short 132.4k, down 50.7k.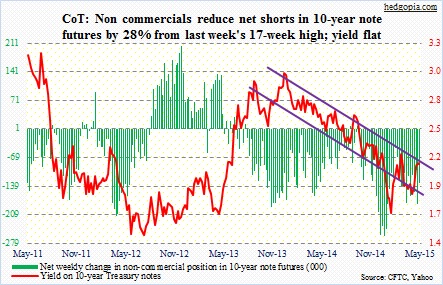
30-year bond: Next week is packed with housing data.
The NAHB/Wells Fargo Housing Market Index for May comes out on Monday. April’s reading was 56, down slightly from the post-bubble high of 59 last September. Historically, builder confidence closely tracks both new-home sales and housing starts; currently, confidence has galloped ahead of both.
Tuesday is housing starts. Both February and March came in under one million (SAAR). Post-bubble, starts slumped to as low as 478,000 (April 2009) and were as high as 2.3 million at the peak (January 2006). The good thing is, builders currently are not putting money where their mouth is. Starts remain subdued, but so is inventory.
Existing home sales for April are on tap for Thursday. March (5.19 million) was the highest since last September (5.26 million). The post-bubble recovery has seen home price recover much faster than sales, which probably has priced out many a potential buyer. The median price of an existing home peaked at $230,400 in July 2006. The post-bubble high of $222,000 in June 2014 never got quite that high but rose from $154,600 in January 2012. March was $212,100.
FOMC minutes for the March meeting are out on Wednesday. At the time, the mid-point of the central tendency of members’ estimates for real GDP growth this year stood at 2.5 percent. Since then, reacting to a barrage of weaker-than-expected data, consensus estimates have nudged lower, to 2.3 percent. It will be interesting to see what the committee thought was causing the weakness, which has softened further since.
Four Fed officials, including both chair and vice-chair, are scheduled to speak. Chair Yellen speaks at one on Friday afternoon and by then she will have April’s CPI data that comes out the same morning.
Last week, the 30-year yield managed to poke its head out of dual resistance, and is still above it. Technically, it is itching to go lower. Will the new support, which also approximates the 200-day moving average, hold?
Currently net long 26.9k, up 15.9k.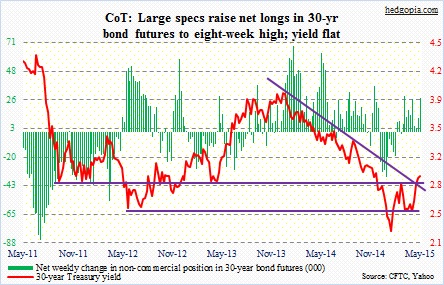
Crude oil: The EIA raised its average forecast for West Texas Intermediate to $54.32/barrel this year from a previous forecast of $52.52, but lowered 2016 from $70.07 to $65.57. Year-to-date, spot WTI has averaged $51.36. If the EIA forecast is right, the crude has room to trade lower. Simplistically, if for the rest of the year the price remains unchanged from Friday’s close, it would have averaged $56.79 for the year, higher than what the EIA expects.
Global crude supply continued to rise in April – by 3.2 million barrels per day year-over-year (courtesy of the IEA). This is huge. OPEC production remained high, as did production in Russia, Brazil, China, Vietnam and Malaysia.
OPEC’s next meeting is set for June 5th. So any chance it would cut the current production quota of 30 million bpd? Maybe not. A Saudi official was quoted as saying the price drop has deterred investment away from expensive oil including U.S. shale, deep offshore and heavy oils. They are happy with the status quo.
This is probably beginning to sink in in the oil pit. For the second consecutive week, spot WTI has produced shooting stars/dojis on a weekly chart. The first line of support lies at 58, where buyers already showed up this Friday as well as last Friday; 54 is a must-hold.
Currently net long 337.8k, down 10.3k.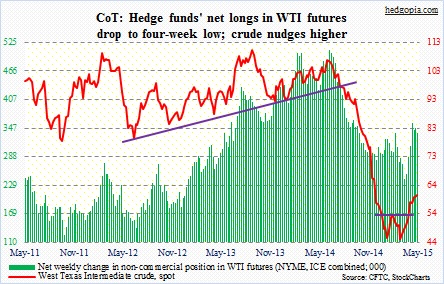
E-mini S&P 500: Another closing high for the S&P 500 large cap index, but no breakout just yet. The index never lost its October 2014 trendline. Other indices have; the Russell 2000 comes to mind. The gap between that trendline and its three-month lateral resistance is narrowing. It is an ascending triangle. More often than not, this tends to resolve in a breakout, as that resistance continues to get pounded from down below. Sellers continue to be on strike.
The earnings bar continues lower. In and of itself, this is no good news, as it pushes up multiples. But if the economy can shake off 1Q (1H?) weakness and come roaring back in 2H – which right at this moment is not looking like a safe bet – these lowered estimates can even nudge higher. For that, the economy must snap back.
In the past three months, 1Q15 estimates for S&P 500 companies have gone from $27.98 to $25.93, 2Q15 from $29.99 to $28.56, 3Q15 from $31.02 to $29.98, 4Q15 from $32.32 to $31.69, 2015 from $121.31 to $116.16, and 2016 from $137.46 to $133.28. 2H15 estimates remain high, hoping the economy strengthens.
Non-commercials continue to maintain their bearish bias. Would they be forced to cover should there be a breakout?
Currently net short 72.8k, down 6.5k.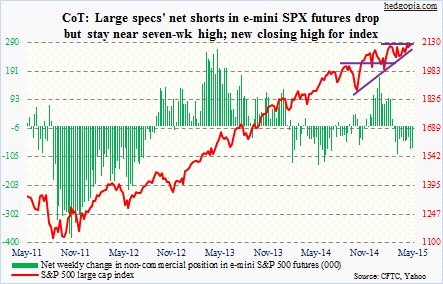
Euro: Eurozone GDP expanded 0.4 percent in 1Q sequentially, better than in the U.S. or the U.K. – the first time in four years this has happened. The question is, is it self-sustaining? A lower euro probably went a long way. However, from the mid-April low the currency has rallied nearly nine percent so far in the second quarter.
These traders had amassed massive net shorts in the currency, and they seem to be covering those; holdings have declined 21 percent from end-March highs.
Currently net short 179k, down 11.2k.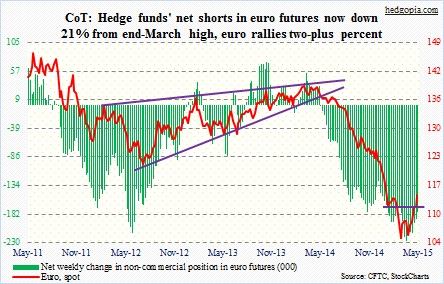
Gold: Of the several things that failed to make sense this week was a strong rally in the metal early on even as interest rates were rising. Is gold a safe-haven play again? Whatever led to the three-percent jump, gold is now sitting smugly above both 50- and 200-day moving averages. Earlier, the metal straddled its 50-day for nearly five weeks before bolting higher. Shorter-term moving averages, as well as 50-day, have turned up.
A big test lies ahead, around 1,260.
Currently net long 77.4k, up 5k.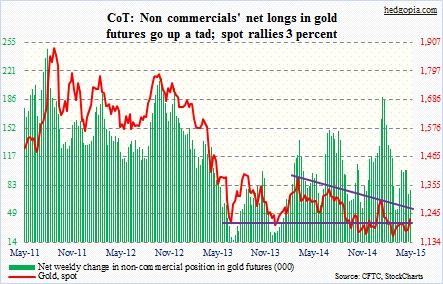
Nasdaq 100 index (mini): The 4480 level continues to be important (109 on the QQQ). On Friday, that level was defended.
Curiously, non-commercials have been cutting back net longs – down 48 percent in two weeks.
Currently net long 66.9k, down 21.5k.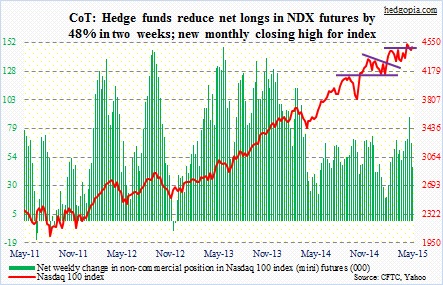
Russell 2000 mini-index: Three weeks ago, it suffered a double whammy, losing 50DMA as well as the October 2014 trendline. The Thursday rally stopped right underneath that average. Ditto with Friday. The index has been under it for 12 straight sessions now. In contrast, both the S&P 500 and the Nasdaq 100 are comfortably above it. Even though the Russell 2000 is acting like a laggard, odds are good that it will soon retake that average. Shorter-term averages are curling up. It is a different ball game if it loses 1215.
These traders do not believe in this scenario. They have been adding to net shorts.
Currently net short 31.8k, up 5.1k.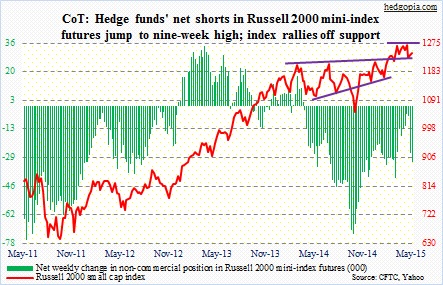
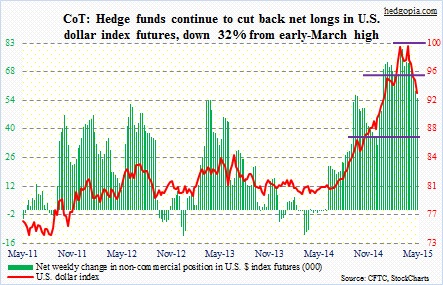
U.S. Dollar Index: The Russian Central Bank said it will be buying $100 million to $200 million a day from the domestic currency market. Russia’s reserves have shrunk from around $470 billion a year ago to $356 billion now. Dollar purchases are designed to boost its reserves, as well as weaken the ruble. But the news was not enough to stem the dollar’s downward trend.
Passengers are beginning to leave the dollar crowded train. Non-commercials have reduced net shorts by 32 percent from early-March highs.
The index (93.18) is approaching a crucial technical level. At 92.40, it would have retraced 38.2 percent of the March 2014-May 2015 rally (more here). Always a good spot to pause/stop downward pressure.
Currently net long 55.3k, down 3.6k.
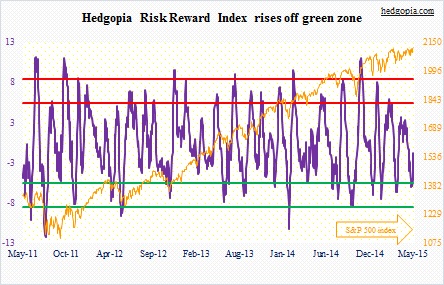
VIX: The count is now five. For the fifth time in the past five weeks, an attempt to push through 15 has been denied. Turns out these traders were prescient. To refresh, Monday’s post discussed mixed signals coming from various indicators. Large specs’ rising net shorts in S&P 500 futures, the VIX to VXV ratio, the CBOE put-to-call ratio as well as the ISE equity call-to-put ratio were bearish, even as HRRI (below) and large specs’ VIX bets were sending bullish signals (more here).
This week, these traders cut back a little, but net shorts remain sizable.
Side note: There has been a pickup in June call activity in recent sessions.
Currently net short 63k, down 12.8k.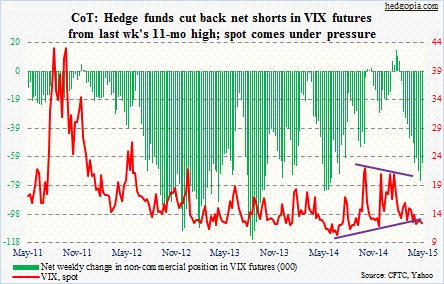
Hedgopia Risk Reward Index