
Bulls put foot down on major US equity indices last week. They have the ball near term. Shorts with medium-term focus can sell weekly puts to raise the short price.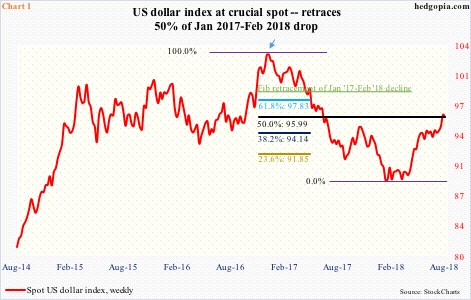
The greenback acts strong. The US dollar index (95.98) hit a 13-month high last week. The week before, it rallied past 95-plus, which provided resistance for 10 weeks before breaking out. Soon afterwards, it began giving out signs of fatigue. In the past five sessions, the daily chart produced a long-legged doji, a shooting star and a hanging man.
Between the intraday low of 88.15 on February 16 and last Wednesday’s high of 96.87, the dollar index appreciated 9.9 percent – in six months. Not a chump change for any currency. So a little giveback is perfectly natural. The question is, will dollar bulls step up to defend 95 when the time comes?
The index began retreating last week at an interesting juncture. It dropped from 103.82 early January last year to this February’s low of 88.15. A 50-percent retracement of that decline lies at 95.99 (Chart 1). Further, in the last decade it went from 121.21 in July 2001 to 71.33 in April 2008, followed by a rally, retracing 61.8-percent of that decline by January last year. The subsequent decline had dollar bulls persistently defending 88-89 in January-April this year. This led the foundation for the latest rally, which has now completed 50-percent retracement of the July 2001-April 2008 decline.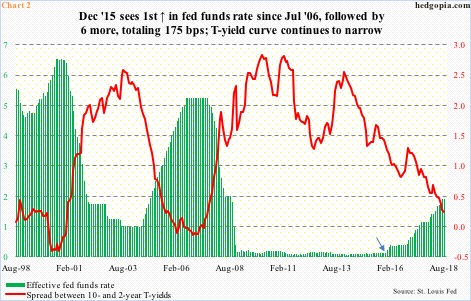
At least near term, the dollar index looks ready to unwind its overbought condition. But what if 95 is defended and the index proceeds toward the highs of January last year (arrow in Chart 1)? This scenario potentially comes true particularly if the Fed maintains its current tightening posture.
After leaving rates at the zero bound for seven long years, the Fed in December 2015 raised the fed funds rate by 25 basis points to a range of 25 to 50 basis points (arrow in Chart 2). Since then, there have been six more hikes. Markets expect another raise in September (futures imply 94 percent probability) and likely another in December (65 percent). By then, the fed funds rate will be between 225 and 250 basis points. Next year, the FOMC dot plot expects three more 25-basis-point hikes. Markets expect one hike next year. Three hikes are not in the price. Should the Fed be right, the dollar index likely gets rerated.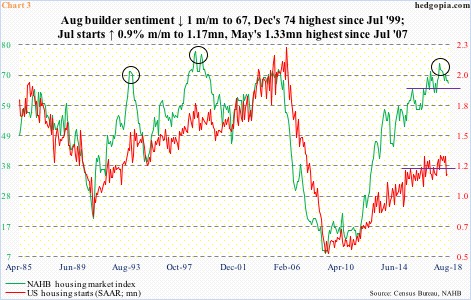
For the Fed to push the fed funds rate toward a three handle next year, the economy has to be performing quite well. It is now, but will it continue to cooperate? Real GDP grew 4.1 percent annually in 2Q (first estimate) – the highest growth rate in 15 quarters. As of last Thursday, the Atlanta Fed’s GDPNow model forecasts 4.3 percent in 3Q. These are fantastic numbers. But not all the data are in agreement with this rosy picture.
Housing, for one, is on the back foot. Since peaking last November, June sales of new and existing homes are down 11.4 percent and 5.9 percent respectively to a seasonally adjusted annual rate of 631,000 units and 5.38 million units.
Similarly, July housing starts were down 11.4 percent from January to 1.17 million units (SAAR). Concurrently, builders are pulling back their horns, with the NAHB housing market index down a point month-over-month in August to 67. December’s 74 was the highest since July 1999 (Chart 3).
In the meantime, manufacturing is softening. The ISM manufacturing index in July fell 2.1 points m/m to 58.1. February’s 60.8 was the highest since May 2004. This level of activity is very elevated, and a reversion to the mean in due course should not come as a surprise. Despite the rise in short rates, the long end of the yield curve refuses to go along. As a result, the yield spread between 10- and two-year T-notes has narrowed to a mere 24 basis points (Chart 2). This scenario does not argue for continuation of strength for the greenback.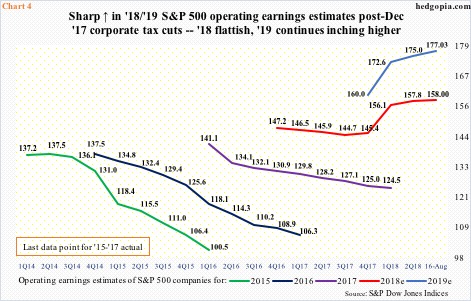
A strong – or stronger – dollar will have consequences for earnings, particularly for S&P 500 companies, as several of them are multinationals with global presence. In 2016, foreign sales of these companies made up just north of 43 percent.
Chart 4 plots operating earnings estimates for five years through 2019. There is a clear change in the revision path for 2018 and 2019 beginning December last year. That is when the Tax Cuts and Jobs Act of 2017 was signed into law. For instance, 2018 estimates on December 21 were $145.31. Last Thursday, they stood at $158. That said, 2018 is now flattish, with a high of $158.24 as of July 26. In contrast, 2019 continues higher, with the latest estimate of $177.03 just slightly lower than $177.13 two weeks ago. The sell-side is famous for starting out optimistic and then lowering estimates as the time to report nears. This revision trend was so vivid in 2015-2017. From this perspective, 2019 estimates are already vulnerable. Even more so if the dollar continues higher, which arguably is stealth tightening.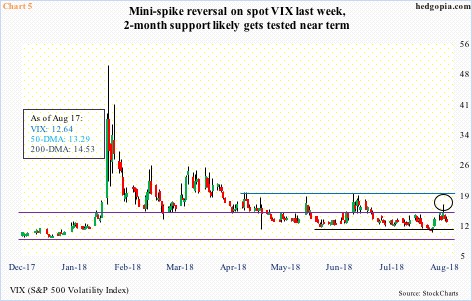
As things stand, stocks are not a bit worried that 2019 estimates may not come through. Far from it. Anytime it attempts to put up a good show, VIX (12.64) keeps getting slammed. Wednesday last week, it shot up to 16.86 intraday before reversing lower (circle in Chart 5), followed by more downside pressure both Thursday and Friday. The 200-day moving average was lost as soon as it was recaptured. Ditto with the 50-day.
For two and a half months now, VIX has found support at just north of 11. This could very well be tested in the sessions ahead.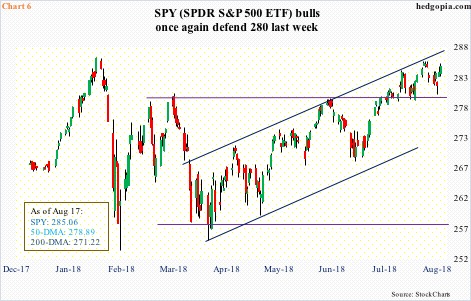
In this scenario, stocks can rally in the very near term. Last week, bulls continued to defend support on major equity indices. On the Russell 2000 small cap index, which is caught in a pennant the past couple of months, the lower bound was defended twice, even as the 50-day attracted bids on Friday. On the Nasdaq 100 index, 7300 was saved, and on the S&P 500 large cap index 2800 drew buyers in. Correspondingly, on SPY (SPDR S&P 500 ETF) $280 was defended.
On the weekly chart last week, SPY produced a hanging man. This was preceded by a weekly shooting star, which also kissed the upper end of a five-month channel. Risks are building medium term. Near term, the ETF could very well rally some. This complicates things for shorts. One strategy they could adopt is sell weekly puts, take in some premium and raise the short price. Hypothetically last week, SPY ($285.06) was shorted in combination with a short put at effectively $283.80. Once again, SPY August 24th 282 put sells at $0.55. This will further raise the short price to $284.35. If instead the short put is exercised, the trade is closed for a profit of $2.35.
Thanks for reading!
