
Following futures positions of non-commercials are as of Nov 7, 2017.
10-year note: Currently net long 50.1k, up 47.3k.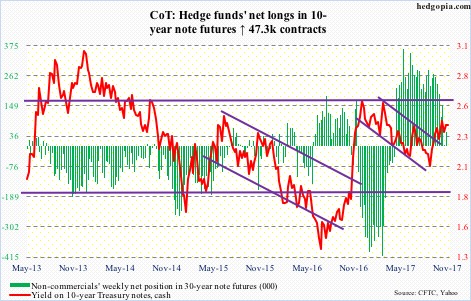
It was yet another instance of 10-year Treasury yields wilting well before even getting close to 2.6 percent. Are they sending a message on the economy?
Yields bottomed at 2.03 percent on September 7 and rallied all the way to 2.48 percent on October 25, before coming under pressure. The subsequent drop stabilized around the 200-day (2.31 percent), with Monday closing at 2.4 percent.
In December last year, yields retreated after hitting 2.62 percent, which was once again tested in March this year – unsuccessfully. Ten-year yields have been trapped in a descending channel for three decades now, and will break out around 2.6 percent. Hence its significance.
As things stand, the weekly chart is overbought, and the daily oversold. If the former wins out in the days/weeks to come, bond bears will be forced to launch another attack on that resistance from probably a much lower level.
30-year bond: Currently net long 39.4k, up 26.7k.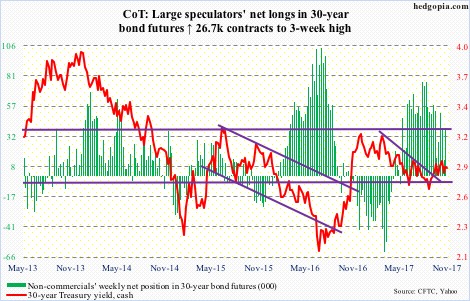
Major economic releases the rest of the week are as follows.
The NFIB optimism index (October) and PPI-FD (October) will be published later today.
Small-business optimism fell 2.3 points month-over-month in September to 103, although August was a hair’s breadth away from 12-year-high 105.9 in January this year. Optimism took off post-presidential election last November, with the last 10 months north of 105.
Producer prices rose 0.4 percent m/m in September. In the 12 months to September, they were up 2.6 percent. Core PPI (excluding food, energy and trade services) rose 0.2 percent and 2.1 percent, respectively.
Wednesday brings CPI (October), retail sales (October), and Treasury International Capital data (September).
Consumer prices increased 0.5 percent m/m in September and 2.2 percent in the 12 months through September. Core CPI rose 0.1 percent and 1.7 percent, respectively.
Retail sales in September increased 4.4 percent y/y to a seasonally adjusted annual rate of $483.9 billion – the fastest growth rate in five months.
Foreigners sold $5.3 billion in U.S. stocks in August, and $17.5 billion worth in June-August. But year-to-August, purchases totaled $40.2 billion. On a 12-month rolling total basis, they were selling a record $142 billion in February last year, before reversing.
Industrial production (October) and the NAHB housing market index (November) are published Thursday.
U.S. capacity utilization rose 0.2 percent m/m in September to 76 percent. Utilization has been rising since bottoming at 75.4 percent in March last year. It reached a cycle high 79.2 percent in November 2014.
Home builder confidence jumped four points m/m in October to 68. It peaked at 71 in March this year, which was the highest since 72 in June 2005.
Housing starts for October are due out Friday. September was down 4.7 percent m/m to 1.13 million units (SAAR) – a one-year low. Starts peaked at 1.33 million units in October last year – the highest since August 2007.
Crude oil: Currently net long 583.1k, up 42.6k.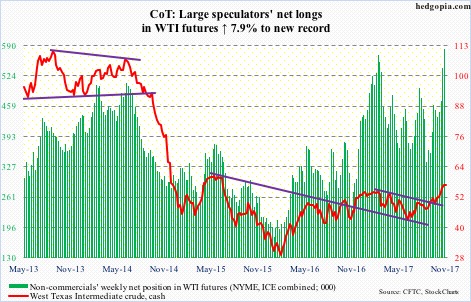
Having rallied nearly 38 percent since the intraday low of June 21, spot West Texas Intermediate crude ($56.76/barrel) is beginning to show signs of fatigue. A trend line from that low measures to nearly $51. Going back further, a trend line from the February 2016 low gets tested just south of $48.
Non-commercials currently are the most net long. Sentiment is giddy.
In the meantime, U.S. crude production just rose to a new record. For the week ended November 3, the EIA showed production rose 67,000 barrels per day to 9.62 million b/d.
Crude imports during the same week fell 194,000 b/d to 7.38 mb/d – a five-week low.
Gasoline and distillate stocks kept declining – by 3.3 million barrels and 3.4 million barrels to 209.5 million barrels and 125.6 million barrels – lowest since November 2014 and March 2015, respectively.
Refinery utilization increased 1.5 percentage points to 89.6 percent.
Crude stocks rose 2.2 million barrels to 457.1 million barrels.
E-mini S&P 500: Currently net long 147.1k, down 14.2k.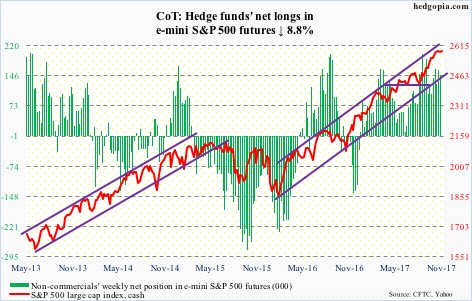
In two out of six sessions through last Thursday, intraday pressure on the cash was snapped up, resulting in candles with long lower shadows. Since they have shown up in an uptrend or at the end of an uptrend, they have a better shot at being a hanging man than a hammer. The former is bearish, the latter bullish.
The bears need to take out the 10- and 20-day to get any traction, with the bulls defending the latter in the last three sessions.
There is plenty of room for the weekly chart to continue lower. Last week produced a spinning top.
SPY (SPDR S&P 500 ETF) continued to see outflows, with $5.4 billion leaving last week. VOO (Vanguard S&P 500 ETF) and IVV (iShares core S&P 500 ETF), however, saw inflows of $1.1 billion and $769 million (courtesy of ETF.com).
In the week through last Wednesday, another $4.7 billion moved into U.S.-based equity funds – now $21.3 billion in the last five (courtesy of Lipper). The S&P 500 has essentially gone nowhere in the last three weeks.
Euro: Currently net long 85.5k, up 13.4k.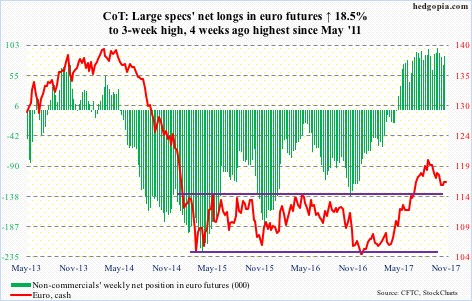
The cash ($116.67) is oversold enough on the daily chart that bids are showing up. Tuesday, the bulls showed up just above the daily lower Bollinger band.
Resistance lies at broken-support-turned-resistance at $116.70, and after that $117.40, which is where a falling trend line from September 8 meets.
In the event of downward pressure, there is support at $114.50-ish, which the euro broke out of in July.
Gold: Currently net long 195.8k, up 2.7k.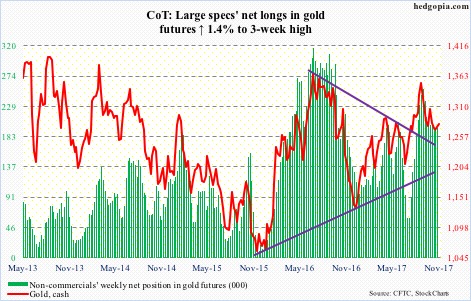
GLD (SPDR gold ETF) last week lost $97 million (courtesy of ETF.com). This was offset by inflows of $87 million into IAU (iShares gold trust).
The cash ($1,278.90/ounce) continues to trade between the 50- and 200-day.
For over two weeks now, buyers have showed up just north of the 200-day. Shorter-term moving averages are flat to slightly dropping. Assuming the 200-day holds, real test lies at $1,300, which is a confluence of the 50-day, horizontal resistance and the daily upper Bollinger band.
Nasdaq 100 index (mini): Currently net long 28.7k, down 13.3k.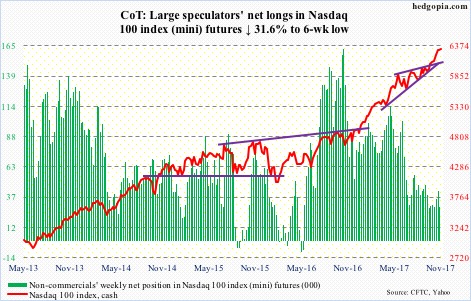
Since a successful breakout retest of 6000 on October 25 through the all-time high of 6346.98 last Wednesday, the cash (6316.18) rallied 5.6 percent. That is in 11 sessions!
It remains to be seen if shorts played a role in this. End-October short interest on XLK (SPDR technology ETF) was elevated.
QQQ (PowerShares QQQ trust) continues to draw in flows – $1.4 billion last week (courtesy of ETF.com).
The risk in all this is that not all are participating in the rally. As of Monday, only 44.5 percent of Nasdaq stocks were above their 50-day, down from 77.8 percent on October 6.
This in and of itself does not mean the generals have to follow the soldiers lower. That said, the weekly chart seems to want to go lower.
There is gap support at 6130, and of course 6000.
Russell 2000 mini-index: Currently net short 1.7k, down 7.7k.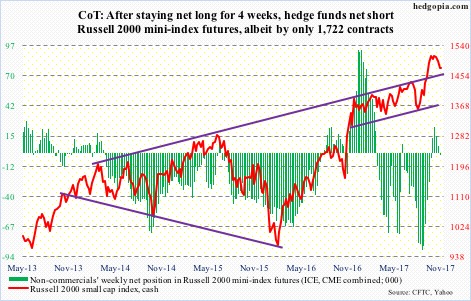
Small-caps’ underperformance versus large-caps continues.
The bulls and bears are fighting a real tug of war around the 50-day. Last week’s low of 1463.49 on the cash (1475.07) was also a successful retest of a break two months ago out of a rising wedge.
If this holds, resistance lies at 1485, and after that the 10- and 20-day – both dropping. In this scenario, some of the daily oversold conditions can get unwound. On the weekly basis, though, the index is way overbought.
In the meantime, non-commercials switched to net short after staying net long for four weeks.
IWM (iShares Russell 2000 ETF) saw outflows of $1.6 billion last week (courtesy of ETF.com). This was somewhat offset by inflows of $162 million into IJR (iShares core S&P small-cap ETF).
US Dollar Index: Currently net long 225, up 1k.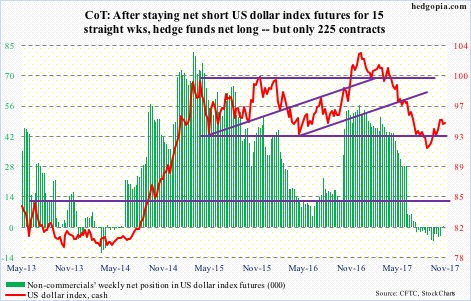
Last Tuesday’s high of 95.07 on the cash essentially tested – unsuccessfully – the prior high of 95.06 on October 27. On October 25, 10-year Treasury yields peaked at 2.48 percent.
The US dollar dollar index (94.39) rallied 4.5 percent in the past couple of months, and is primed to give at least some of it back.
Immediate support lies at 94, which also approximates the 20-day. The 50-day – rising – lies at 93.21.
Non-commercials dipped their toe in the net long arena. Let us see if they begin to aggressively add.
VIX: Currently net short 153.3k, up 8k.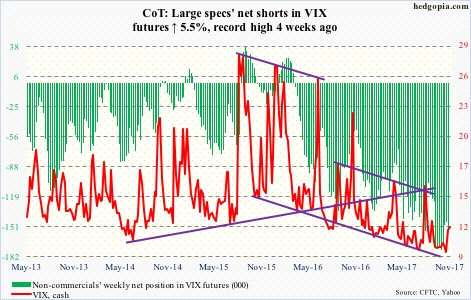
The cash (11.50) shot up 2.41 intraday last Thursday to 12.19 but only to close up 0.72. In the 16 sessions leading up to this, this was the third instance in which VIX tried to rally past the 200-day but only to get slapped hard, resulting in a session with a long wick. Come Friday, volatility bulls launched another attack on that average – this time successfully.
The weekly chart is very oversold.
Meanwhile, after staying trapped in high 0.70s-low 0.80s in 10 out of 11 weeks, the VIX-to-VXV ratio closed at 0.83 last week, and has tons of room for unwinding. Coiled spring!
Thanks for reading!
