
Following futures positions of non-commercials are as of Nov 28, 2017.
10-year note: Currently net long 123.9k, up 12.9k.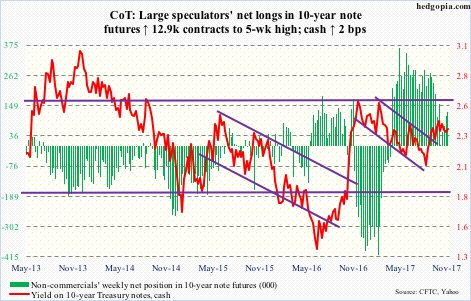
The U.S. economy is in its ninth year of recovery.
Post-Great Recession, real GDP has grown at an average 2.2 percent. This compares with the long-term average of 3.2 percent going all the way back to 2Q47.
Yes, the recovery is subdued but it is recovery nonetheless. The ISM manufacturing index in November dropped five-tenths of a point month-over-month to 58.2, but September’s 60.8 was the highest since 61.4 in May 2004.
Ironically, the U.S. government continues to suffer from a mismatch between receipts and outlays. In fact, it is widening. On a 12-month rolling total basis, September’s deficit – yes, deficit! – totaled $665.7 billion. In February 2010, the deficit peaked at $1.48 trillion, then bottomed at $403.6 billion in January 2016.
Amidst all this we have the proposed tax cuts. If they are signed into law – looking increasingly likely – the deficit is bound to increase.
Yet, 10-year Treasury yields (2.36 percent) continue to act sanguine. The last time they tried to break through 2.6 percent was in March this year. It so happens this is where these yields will have broken out of a three-decade-old descending channel.
The long end absolutely does not act like it believes the tax cuts will generate the kind of growth espoused by the proponents. Worse, the increasingly narrowing yield curve possibly reflects some other concerns.
In recent quarters, U.S. economic data have put up strong performance, with real GDP growing 3.3 percent in 3Q07 and 3.1 percent prior to that. Bond vigilantes probably fear that the path of least resistance in quarters ahead is deceleration from here.
30-year bond: Currently net long 64k, up 4.3k.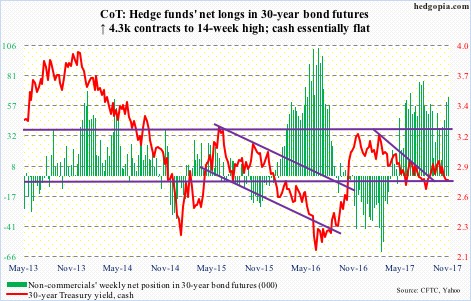
Major economic releases next week are as follows.
Revised data for durable goods for October as well as non-durable goods will be published Monday. Orders for non-defense capital goods ex-aircraft – proxy for business capital expenditures – increased 8.2 percent year-over-year in October to a seasonally adjusted annual rate of $66.2 billion. This is a phenomenal growth rate, until you realize that year-ago numbers were suppressed. Orders peaked at $70.3 billion in September 2014, bottoming at $59.9 billion in May last year. October orders fell 0.5 percent m/m.
The ISM non-manufacturing index for November is scheduled for Tuesday. Services activity inched up three-tenths of a point m/m in October to 60.1 – the highest ever (data only goes back to January 2008).
Revised productivity numbers for 3Q17 come out Wednesday. Preliminarily, output per hour rose 1.47 percent y/y in 3Q17, and has gradually risen in the past four quarters. This followed three quarters of contraction.
Friday brings November’s employment report and the University of Michigan’s consumer sentiment index (December, preliminary).
October created 261,000 non-farm jobs, following 18,000 in the prior month. With this, year-to-October, monthly job creation has averaged 169,000. In 2016, the average was 187,000, versus 226,000 in 2015 and 250,000 in 2014.
Consumer sentiment fell 2.2 points m/m in November. October’s 100.7 was the highest since 103.8 in January 2004.
Crude oil: Currently net long 651.1k, up 39.5k.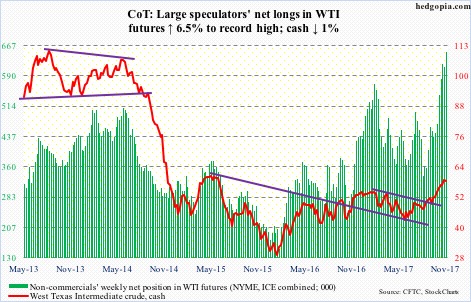
OPEC and Russia agreed to extend their existing crude production cut of 1.8-million barrels per day beyond March next year to December. Markets were expecting an extension. This has the potential to set off the proverbial ‘buy the rumor, sell the news’ phenomenon.
Spot West Texas Intermediate crude ($58.36/barrel) rallied into this, rising to $59.05 last Friday, before slightly coming under pressure. It has come a long way. In February last year, the crude bottomed at $26.05, and most recently at $42.05 in June this year.
Non-commercials are the most net long ever.
There is plenty of room for the crude to continue lower on the weekly chart. There is currently a tug of war between the bulls and bears around shorter-term moving averages. Once these get taken out, support lies at $54-55, followed by the 50-day ($53.93).
The EIA report for the week of November 24 showed U.S. crude production continued to rise, up 24,000 b/d to 9.68 mb/d. Since the OPEC deal in November last year, production has gone up by 983,000 b/d.
Both gasoline and distillate stocks increased, up 3.6 million barrels and 2.7 million barrels to 214.1 million barrels and 127.8 million barrels, respectively.
Crude stocks, however, fell 3.4 million barrels to 453.7 million barrels. As did crude imports, which dropped 544,000 b/d to 7.33 mb/d.
Refinery utilization rose 1.3 percentage points to 92.6 percent.
E-mini S&P 500: Currently net long 112.5k, down 11.8k.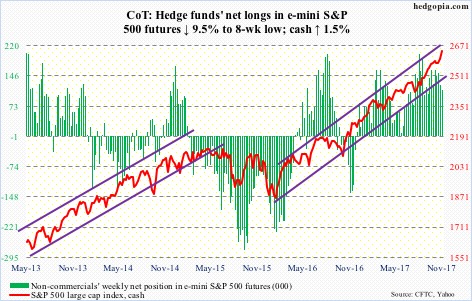
The cash rallied all along the daily upper Bollinger band in the past eight sessions, with the last four well outside.
Friday’s intraday 1.6-percent dip was bought near the 10-day to end the session down 0.2 percent.
The atmosphere is complacent. Investors Intelligence bulls have been 60 percent or higher in the past eight weeks, with the ratio of bulls to bears north of four or higher in six of those and the other two at 3.95 and 3.99.
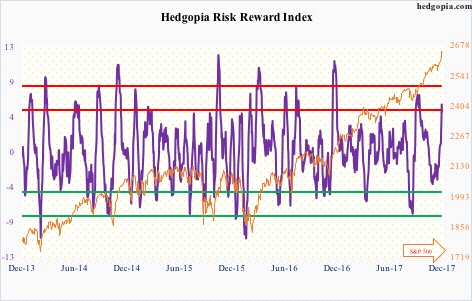
Our own Hedgopia Risk Reward Index has turned lower after entering the red zone.
Seasonality favors the bulls, but risks are rising a pullback occurs soon – duration and magnitude notwithstanding.
In the week to Wednesday, per ETF.com, $252 million flowed into VOO (Vanguard S&P 500 ETF) and $52 million into IVV (iShares core S&P 500 ETF). But this paled in comparison to $1.3 billion in withdrawals from SPY (SPDR S&P 500 ETF).
U.S.-based equity funds did attract $2.4 billion, though. In the last eight, inflows have totaled $29.4 billion (courtesy of Lipper).
Euro: Currently net long 89.7k, down 5.8k.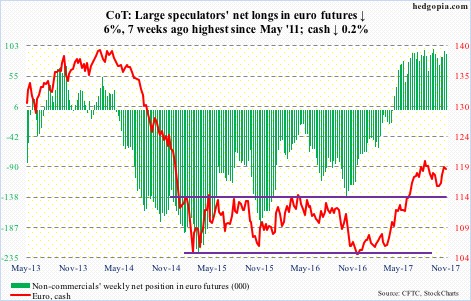
The annual rate of Eurozone inflation rose 1.5 percent in November, up from 1.4 percent in October, but came in below expectations of 1.6 percent. Core inflation came in at 0.9 percent, unchanged m/m.
In recent quarters, the Eurozone economy has performed very well, but inflation remains under the ECB’s target of ‘below, but close to, two percent.’
The cash ($118.96) rallied 0.5 percent Thursday (inflation data was released that day), finding support at the 10-day a session earlier, and remains above major averages.
The currency peaked on September 8 at $120.69. Resistance around that level goes back nearly two decades.
Gold: Currently net long 224.4k, up 22.6k.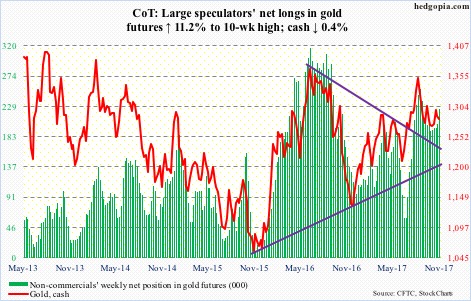
Once again, the cash ($1,282.30/ounce) was repelled at $1,300 – rallied to $1,301.30 on Tuesday – followed by selling pressure. Subsequently, it lost the 50-day, although ever so slightly.
For over a month now, gold bugs have consistently stepped up just above the 200-day ($1,267,81). It is a must-save.
Flows continue to be tentative. In the week to Wednesday, GLD (SPDR gold ETF) lost $160 million (courtesy of ETF.com) – more than $124 million in inflows IAU (iShares gold trust) took in.
Nasdaq 100 index (mini): Currently net long 5.6k, down 10.1k.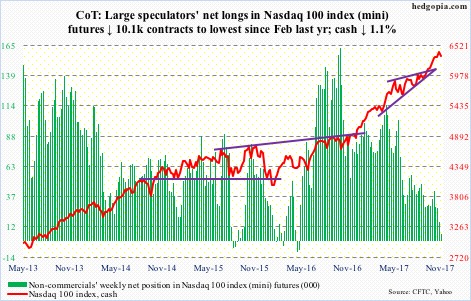
After nine consecutive positive weeks, the cash (6337.87) fell 1.1 percent this week.
QQQ (PowerShares QQQ trust) in the week through Wednesday lost $325 million (courtesy of ETF.com).
Wednesday produced an ominous-looking candle. A session earlier, the Nasdaq 100 rose to a new all-time high of 6426.04. Friday’s crazy session was bought near the daily lower Bollinger band, but the bulls lost the 10-day. This is an opening for the bears.
XLK (SPDR technology sector ETF) shorts have steadfastly stuck to elevated short interest for a year now.
That said, there is plenty of support underneath for the bulls to step up to – 6130 being one. The 50-day lies at 6174.16.
Russell 2000 mini-index: Currently net long 6.8k, up 12.7k.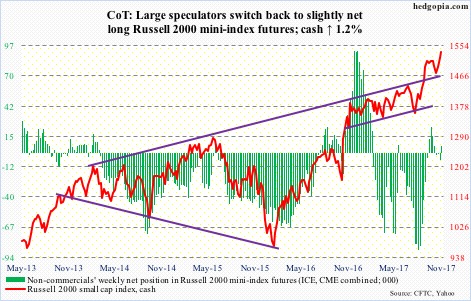
Small-cap bulls did it again.
Last week’s rather feeble breakout on the cash (1537.02) was defended early this week, before jumping 1.5 percent Tuesday.
The bears had a big opportunity Friday when the Russell 2000 dropped to an intraday low of 1498.78, but the bulls defended the 50-day (1498.48). The resulting candle, one wonders if it is a hammer (bullish) or a hanging man (bearish).
Regardless, the daily chart is itching to go lower.
In the week ended Wednesday, ETF.com shows IWM (iShares Russell 2000 ETF) lost $20 million, but this was more than offset by inflows of $460 million into IJR (iShares core S&P small-cap ETF).
US Dollar Index: Currently net short 10.6k, up 4k.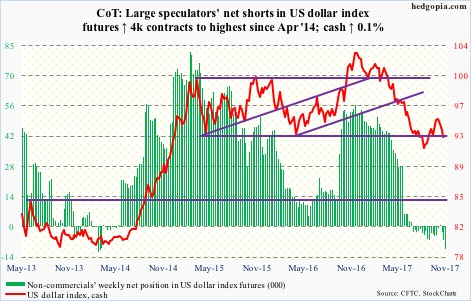
Beginning March 2015, the cash (92.84) traded between a range of 100-101 on the up and 92-93 on the down. In November, it briefly broke out, before coming under sustained pressure.
Dollar bears once again have been hammering on the lower end of that range, which is yet to give way.
That said, the dollar index remains under the 50-day (93.56). The 200-day (96.09) is way above.
Non-commercials have been right to avoid this. More likely, this is the reason the cash cannot rally.
VIX: Currently net short 114.8k, up 11.8k.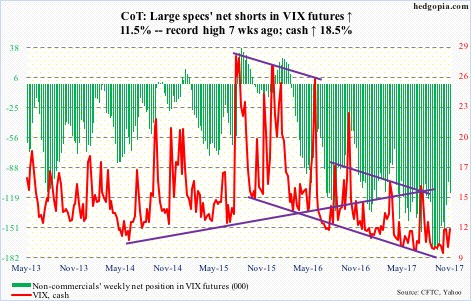
The cash acts strange. For the week, it rallied 18.5 percent, even as the S&P 500 rallied 1.5 percent. They normally have an inverse relationship.
Friday’s was even stranger. VIX rallied intraday to 14.58 but only closed up 0.15 to 11.43. This has the look of a spike reversal candle. Early next week will be crucial.
Other metrics show complacency is building.
Using a 10-day moving average, the CBOE equity put-to-call ratio Friday registered 0.57, which was the lowest since December 19 last year, while on Wednesday the ISEE index (equity) stood at 165.9 – the highest since April 28, 2015. (The ISEE is a call-to-put ratio – more here.)
Thanks for reading!
