
Following futures positions of non-commercials are as of May 1, 2018.
10-year note: Currently net short 445.7k, down 16.5k.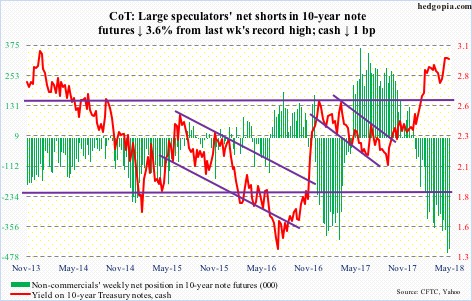
US inflation of late has firmed up. Core PCE – the Fed’s favorite measure of consumer inflation – jumped 1.88 percent year-over-year in March, up from up 1.57 percent in February. Ditto with core CPI, which rose 2.12 percent y/y in March – the first two-plus reading in a year. Both these measures have trended higher since last September (more here).
The Fed has a two percent target, but not a ceiling. Thus markets’ preoccupation with this week’s FOMC meeting as to what they might say how they view recent inflation prints. In the end, they did not give out much signal. If there was, then it is that they don’t seem too concerned.
The below is from the post-meeting statement:
“Inflation on a 12-month basis is expected to run near the Committee’s symmetric 2 percent objective over the medium term.”
Possibly because, “risks to the economic outlook appear roughly balanced.”
The US economy is decelerating from a decent pace.
The ISM manufacturing index dropped two points month-over-month in April to 57.3. February’s elevated 60.8 was the highest since May 2004.
Enter 10-year Treasury yields (2.94 percent). For the first time in over four years, yields surpassed three percent last week (3.04 percent on April 25). Early April, the 10-year yielded 2.72 percent. Many a shop probably view yields north of three percent as an opportunity to go long these notes (more here). After a weekly hammer reversal last week, TLT (iShares 20+ year Treasury bond ETF) this week was only up 0.1 percent but produced a long-legged doji.
Non-commercials cut back a tad this week their record net shorts in 10-year note futures. Continued unwinding can push yields lower.
30-year bond: Currently net short 6.7k, up 25k.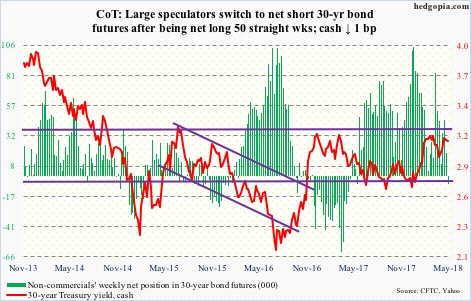
Major economic releases next week are as follows.
Tuesday brings the NFIB optimism index (April) and JOLTS (March).
Small-business optimism fell 2.9 points month-over-month in March to 104.7. February’s 107.6 was the second highest level in its history (monthly surveys go back to 1986).
Non-farm job openings in February fell 176,000 m/m to 6.05 million. January’s 6.23 million matched last September’s record high.
PPI-FD for April is scheduled for Wednesday. Producer prices rose 0.3 percent m/m in March and three percent y/y. On that same basis, core PPI increased 0.4 percent and 2.9 percent respectively.
Thursday has April’s CPI on tap.
May’s preliminary reading of University of Michigan’s consumer sentiment index is due out Friday. Sentiment fell 2.6 percentage points m/m in April to 98.8. March’s 101.4 was the highest since January 2004.
Crude oil: Currently net long 743.5k, down 15.6k.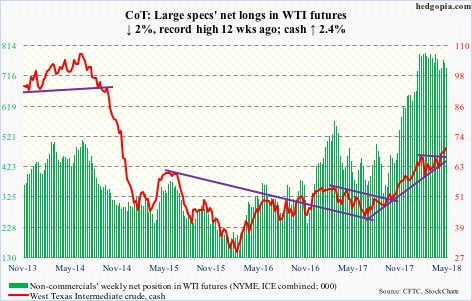
There was another breakout retest this week on spot West Texas Intermediate crude ($69.72/barrel) and it held. On Tuesday through Thursday, buyers defended the 10-day moving average. Resistance around the current level goes back to September 2005, but kudus to the bulls, they keep attacking it.
In the meantime, the EIA report for the week of April 27 continued to show buildup in crude stocks, production and imports – respectively up 6.2 million barrels to 436 million barrels, up 33,000 barrels/day to 10.62 million b/d, and up 80,000 b/d to 8.55 mb/d.
Gasoline stocks increased as well, up 1.2 million barrels to 238 million barrels. Distillate stocks, however, fell 3.9 million barrels to 118.8 million barrels.
Refinery utilization rose three-tenths of a percentage point to 91.1 percent.
E-mini S&P 500: Currently net long 229.2k, up 18.3k.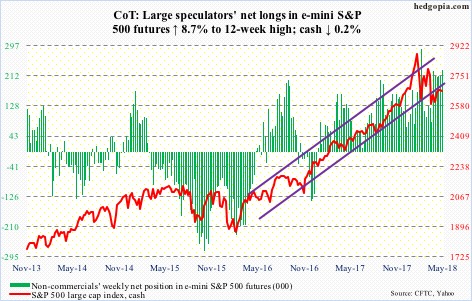
Since February 9, the cash (2663.42) has made higher lows, the latest of which came Thursday when it sliced through the 200-day to an intraday low of 2594.62 before buyers pushed it back above. In the past three months, the 200-day has been tested several times even as rally attempts got denied at a falling trend line from January 26 when the S&P 500 peaked at 2872.87.
Medium- to long-term, inability to quickly lift off of the 200-day (2615.98), which many view as a line to signal trend change, perhaps does not bode well for the bulls. Near term, 2600 – or thereabouts – should draw buyers. The daily chart is oversold.
In the week to Wednesday, US-based equity funds (including ETFs) gained $1.1 billion (courtesy of Lipper.com).
In the same week, SPY (SPDR S&P 500 ETF) gained $1.5 billion, VOO (Vanguard S&P 500 ETF) $37 million and IVV (iShares core S&P 500 ETF) $360 million (courtesy of ETF.com).
Euro: Currently net long 120.6k, down 10k.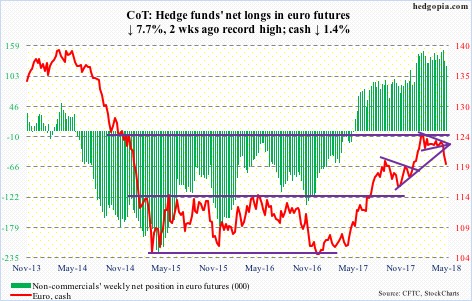
Last week’s loss of support at $122-122.50 built momentum as the cash ($119.71) this week proceeded to lose the 200-day ($120.05).
This whole thing evolved as the euro was repelled late January at a falling trend line from the all-time high of $160.20 from April 2008. The monthly chart, in particular, remains grossly overbought.
The daily chart, on the other hand, is in oversold territory. Relief rally is possible near term.
Gold: Currently net long 106.8k, down 29.9k.
In two weeks, the cash ($1,314.70/ounce) travelled from the daily upper Bollinger band to the lower. After getting rejected at $1,360-70 resistance on April 18, gold quickly dropped to test $1,300, which is the lower bound of a nearly two-year range.
This time around, that support approximates the 200-day as well as a rising trend line from December 2016. A loss of this exposes the metal to a test of trend-line support around $1,285 from December 2015. That was when gold bottomed at $1,045.40 after peaking in September 2011 at $1,923.70. Gold bugs cannot afford to lose this.
By the looks of things, they are not ready to give away $1,300. There is room to rally (more here), particularly if the US dollar weakens. The 50-day lies at $1,329.77.
Flows can always improve. In the week through Wednesday, GLD (SPDR gold ETF) lost $187 million, even as IAU (iShares gold trust) took in $88 million (courtesy of ETF.com).
Non-commercials are the other wildcard. They have been cutting back net longs. But even in the face of this, the cash has not lost $1,300.
Nasdaq 100 index (mini): Currently net short 13.9k, down 10.8k.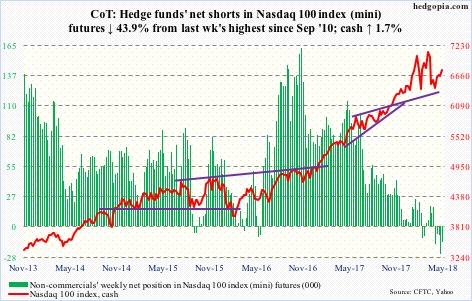
The cash is pretty much caught in no-man’s land. On Friday last week, the Nasdaq 100 was heavily rejected at the 50-day. Post-April jobs report this Friday, it retook that average. After February 9, it has consistently made higher lows. Near term, the path of least resistance is likely up.
Particularly if non-commercials, still net short, begin to accumulate net longs.
In the week to Wednesday, QQQ (PowerShares QQQ ETF) took in $87 million (courtesy of ETF.com).
Russell 2000 mini-index: Currently net long 23.4k, up 3.1k.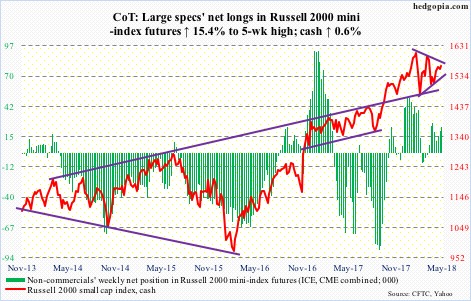
The cash (1565.60) continues to trade within a three-month symmetrical triangle. Near term, the Russell 2000 has a shot at 1580s, which is where trend-line resistance from late-January all-time highs lies.
In the week to Wednesday, $114 million moved into IJR (iShares core S&P small-cap ETF), even as IWM (iShares Russell 2000 ETF) lost $62 million (courtesy of ETF.com).
US Dollar Index: Currently net short 1.7k, down 47.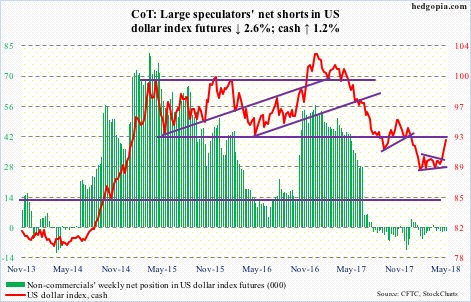
Momentum continued to feed on itself, but not before giving out signs of fatigue. In 14 sessions ended Friday, the cash (92.41) intraday went from 88.94 to 92.75, for a cool 4.3 percent. That is huge in the currency land. Wednesday also produced a long-legged doji, just outside the 200-day (91.87), followed by a shooting star Friday.
The latest rally precedes persistent defense of long-term support at 88-89. The US dollar index last week also broke out of a symmetrical triangle. A measured-move approach would put the target at 92.50. Plus, 92-93 has proven to be an important level going back to at least 1998.
The path of least resistance is down near term. Besides 91, there is another layer of support at 90.30-ish.
Non-commercials continue to remain on the sidelines.
VIX: Currently net long 21k, down 10.7k.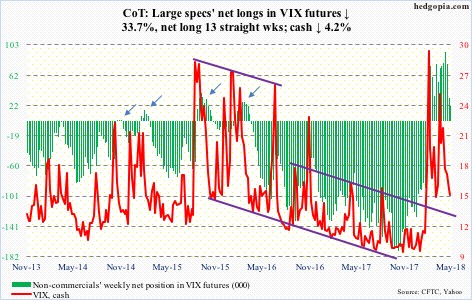
Thursday, with an intraday high of 18.66, the cash (14.77) got rejected at the 50-day. Friday, with an intraday low of 10.91, VIX closed down 7.1 percent but rallied its way back above the 200-day.
In a worse-case scenario for volatility bulls, a loss of 15-16 support can mean the door to low-teens, or low double-digits, is now open. This is particularly so if non-commercials continue to reduce net longs, which probably took place Friday as the cash out of nowhere went sub-11 intraday. This week’s CoT data is as of Tuesday, so does not capture this.
Thanks for reading!
