
Following futures positions of non-commercials are as of October 9, 2018.
10-year note: Currently net short 622.4k, down 117.8k.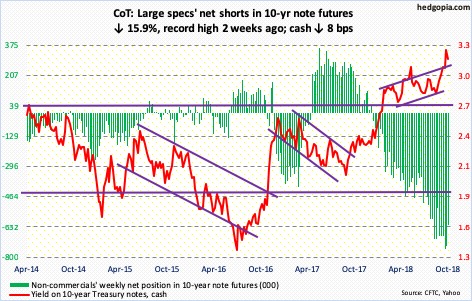
Back in July 2016, the 10-year Treasury rate (3.14 percent) bottomed at 1.34 percent. Since then, it has made higher lows. A rising channel drawn thereof extends to 3.5-3.6 percent. There is also horizontal resistance at that level. In a best-case scenario for bond bears, this resistance could get tested.
Last Friday, the 10-year yield rallied to 3.25 percent intraday before coming under pressure. As recently as August 22, these notes yielded 2.81 percent, meaning the yield jumped 44 basis point in less two months. In September last year, they yielded 2.03 percent. They have come a long way. On nearly all timeframe, conditions are overbought.
Eight sessions ago, the 10-year rate broke past the mid-May high of 3.12 percent. This resistance goes back to at least June 2003. Thus the significance of breakout retest, which is just a few basis points away. Bears would love to see renewed selling (of these notes) at/near this yield, but odds are they have to grapple with bulls who likely will be more interested in going long than just recently. If and when the latter put their foot down and get aggressive, short squeeze is a real possibility. Non-commercials have cut back the past couple of weeks, but remain heavily net short.
30-year bond: Currently net short 138.4k, up 18.6k.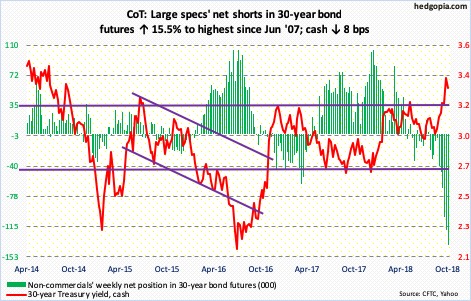
Major economic releases next week are as follows.
Retail sales for September are due out Monday. Sales increased 6.6 percent year-over-year in August to a seasonally adjusted annual rate of $509 billion.
Tuesday brings industrial production (September), JOLTS (August), NAHB housing market index (October) and Treasury International Capital data (August).
Capacity utilization in August was 78.1 percent. Utilization has inched lower since April’s 78.2 percent. The cycle high 79.6 percent was reached in November 2014.
Non-farm job openings rose 117,000 month-over-month in July to 6.94 million, a new record.
Builder sentiment was unchanged m/m at 67 in September. Last December’s 74 was the highest since 75 in July 1999.
Foreigners’ net purchases of US equities in the 12 months to July totaled $28 billion, down from $135.7 billion in January.
On tap for Wednesday are housing starts (September) and FOMC minutes (September 25-26).
August starts increased 9.4 percent y/y to 1.28 million units. January’s 1.33 million was the highest since 1.35 million in July 2007.
The Fed hiked the fed funds rate by 25 basis points in the September 25-26 meeting to a range of 200 to 225 basis points. This was a third hike this year, and eighth since December 2015 when the bank began raising after leaving rates near zero for seven long years.
September’s existing home sales are scheduled for Friday. Sales were unchanged m/m in August at 5.34 million units (SAAR). Last November’s 5.72 million was the highest since 5.79 million in February 2007.
Crude oil: Currently net long 573.2k, down 23.5k.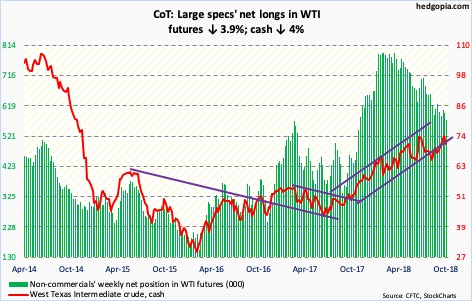
Following last week’s weekly shooting star, spot West Texas Intermediate crude ($71.34/barrel) continued to unwind daily overbought condition. The crude gave back four percent this week. There is room for more downside pressure, particularly if the weekly starts to dominate action. A trend line from June last year gets tested around $68.
The EIA report for the week of October 5 was a mixed bag. US crude stocks rose six million barrels to 410 million barrels. Gasoline stocks increased 951,000 barrels to 236.2 million barrels. Refinery utilization fell 1.6 percentage points to 88.8 percent. Crude production grew 100,000 barrels per day to 11.2 million b/d. Distillate stocks, on the other hand, fell 2.7 million barrels to 133.5 million barrels. Crude imports decreased 568,000 b/d to 7.4 mb/d.
E-mini S&P 500: Currently net long 255.8k, up 27.8k.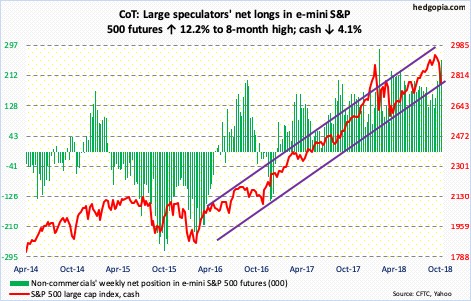
The cash (2767.13) lost 4.1 percent this week. In just a couple of sessions, it sliced through both the 50- and 200-day moving averages, but rallied Friday to literally close on the latter. Worryingly for the bulls, trend-line support from the lows of February 2016 has been breached.
Amidst the chaos, dip-buyers showed up. In the week through Wednesday, SPY (SPDR S&P 500 ETF) took in $2.7 billion, IVV (iShares core S&P 500 ETF) $644 million and VOO (Vanguard S&P 500 ETF) $1 billion (courtesy of ETF.com). Although in the same week, US-based equity funds (including ETF’s) lost $2.6 billion (courtesy of Lipper.com).
The ferocity of this week’s selling has pushed several indicators into oversold territory. Thursday, only 11 percent of S&P 500 stocks were above their 50-day. In February 2016, this dropped to nine percent. That was a major low in stocks.
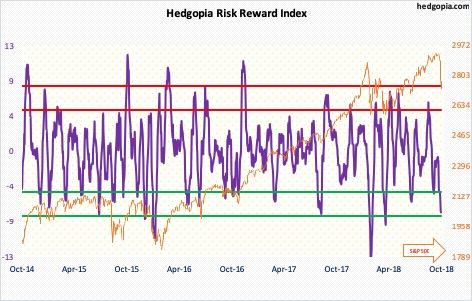
At least a bounce is imminent near term. Our own Hedgopia Risk Reward Index is in the green zone. A test of the underside of the aforementioned broken February trend line takes place around 2800.
Euro: Currently net short 16.1k, up 9k.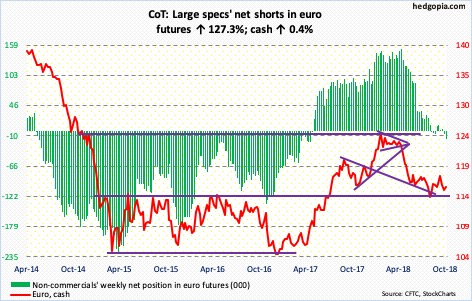
Support at $115-plus was breached Monday before the cash ($115.75) began to rally to unwind its daily oversold condition. In the right circumstances for euro bulls, there is room for it to continue higher near term. For that, the 50-day (115.87) needs to be recaptured.
Three weeks ago, the currency was rejected at just north of $118. That is about where the underside of a broken trend line from early 2017 rests.
Gold: Currently net short 38.2k, up 16.4k.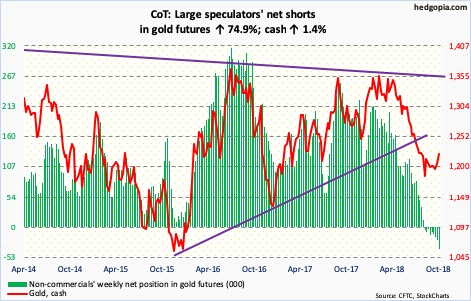
Breakout. Finally. In a high-volume session Thursday, the cash ($1,222/ounce) jumped 2.9 percent to recapture both the 50-day and broken-support-turned-resistance at $1,213-ish. This was preceded by back-to-back long-legged dojis just above the daily lower Bollinger band on Tuesday and Wednesday; bulls once again also defended support at $1,180s, which goes back nine years.
This can prove to be an important breakout in due course. The weekly MACD just completed a potentially bullish crossover. That said, the way the metal dropped from $1,369.40 in April to $1,167.10 in August, resistance is galore. Nearest one lies at $1,240-ish.
For a change, in the week through Wednesday GLD (SPDR gold ETF) gained $337 million. This was the first positive week in 11. In the same week, IAU (iShares gold trust) lost $6 million (courtesy of ETF.com).
Nasdaq 100 index (mini): Currently net long 11.3k, down 24.9k.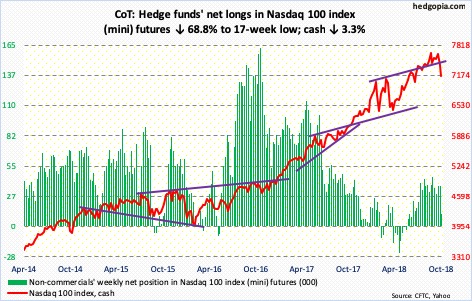
Depending on how one draws it on the cash (7157.21), a rising trend line from February is either lost or was tagged Thursday. The 200-day was lost Thursday but retaken in a hammer session Friday.
The selling the past couple of weeks has pushed the daily into extreme oversold condition. Thursday, only six percent of Nasdaq 100 stocks were above their 50-day – the lowest since February 2016 lows.
A relief rally is due. Remains to be seen if shorts use this as an opportunity to get active. What transpires around 7300 will be telling.
In the week ended Wednesday, QQQ (Invesco QQQ Trust) lost $2.3 billion (courtesy of ETF.com).
Russell 2000 mini-index: Currently net short 48k, up 10.1k.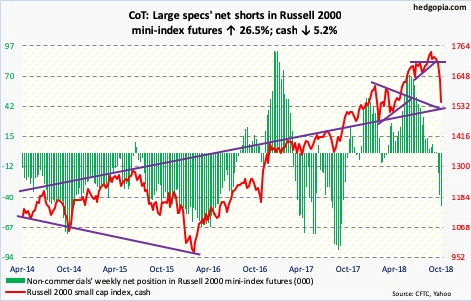
Of the major US equity indices, the cash (1546.68) is the one to sustain the maximum damage in the latest carnage. Among others, it sliced through a rising trend line from February 2016, lost major horizontal support at 1610-ish and lost both 50- and 200-day. On the monthly, a potentially bearish MACD cross-under just developed. For small-cap bulls, these are medium- to long-term worries.
Near term, a bounce is due – if nothing else just to unwind daily oversold condition. Friday produced a long-legged doji. What the bulls do not want to see happen is withdrawals from small cap-focused ETF’s. In the week to Wednesday, IWM (iShares Russell 2000 ETF) pulled in $228 million and IJR (iShares core S&P small-cap ETF) $127 million (courtesy of ETF.com). But this came in a week in which the Russell 2000 lost 5.2 percent. The risk is if longs get shaken out by this and begin to exit.
US Dollar Index: Currently net long 37.7k, up 673.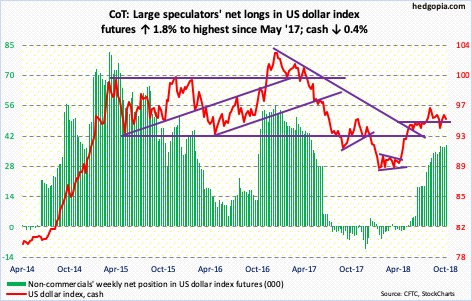
As important a level as 95-plus has proven to be – particularly since late May – a bull-bear tug of war continues around this level. Tuesday, the cash (94.91) rallied to 95.84 intraday but the session ended up in the red with a shooting star. By Thursday, it lost the 50-day (95.03), now flattish. In a worse-case scenario near term, it can drop to 93.30-ish, which was defended three weeks ago.
VIX: Currently net short 113.6k, down 26.8k.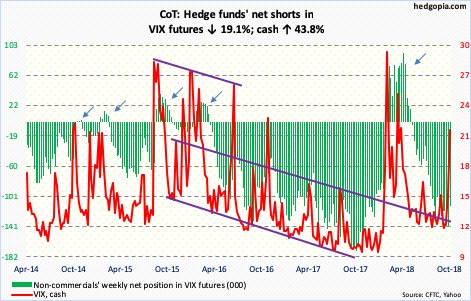
The cash (21.31) quickly shot up intraday from 11.72 last Friday to Thursday’s 28.84. The Thursday high can potentially be a spike reversal. The daily chart is way overbought. There is room for VIX to head lower.
In the meantime, the VIX-to-VXV ratio closed Thursday at 1.16 – 1.22 intraday. This is way overbought. Friday closed at 1.07. As the ratio starts to unwind, premium tends to come out of VIX faster than VXV. Historically, this tends to bode well for equities.
Thanks for reading!
