The following are futures positions of non-commercials as of July 14, 2015. Change is week-over-week.
10-year note: Fed Chair Janet Yellen during her mid-week Humphrey-Hawkins testimony reiterated her desire to hike interest rates later this year, if data cooperate. On Wednesday, 10-year yields responded to this by first rallying and then giving it all back as the session progressed. There are probably two reasons for this.
First, markets continue to treat the FOMC’s hawkish message with a yawn. They just don’t buy it. Second, short- and medium-term technicals were overbought, and they are getting unwound. Concurrently, TLT, the iShares 20+ Year Treasury ETF, remains oversold. It has retaken support-turned-resistance at 118, as well as the 50-day moving average, which has gone flattish and likely is in the process of curling up.
Non-commercials are probably leaning this way as well. Net shorts are substantially down from 11 weeks ago.
Currently net short 5.6k, down 27.1k.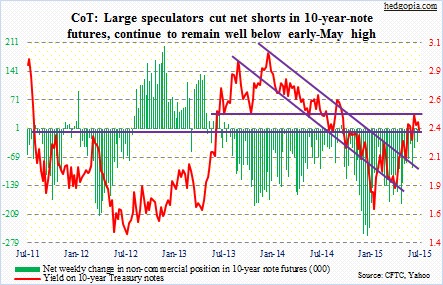
30-year bond: Next week is relatively light on economic data. There are two important releases and both are related to housing.
Existing home sales for June come out on Wednesday, and new home sales on Friday. Of late, trends have been encouraging in both.
Sales of existing homes have exceeded five million units for three consecutive months, after 12 months of sub-five readings. In new homes, for the first time post-bubble, sales crossed the 500,000 mark in January, and since have remained north of that.
Momentum could also be building in housing starts. In eight out of the last nine months to June, starts have been north of one million units, driven primarily by multi-family units. And last but not the least, builder sentiment continues to remain very optimistic. The NAHB/Wells Fargo Housing Market Index reached 60 in June – for the first time post-bubble – and stayed there in July. With that said, sales and starts have a long ways to go before they catch up to builders’ optimism.
No Fed official is scheduled to speak – first time in a while!
Currently net short 4.9k, up 15.8k.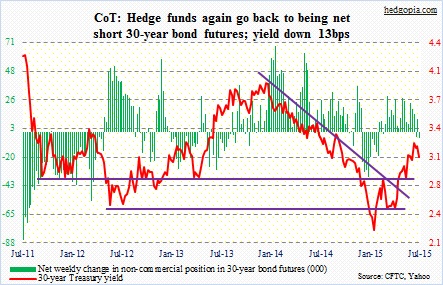
Crude oil: Historic! The U.S. and five allies reached an accord with Iran on Tuesday, under which Iran would curb its nuclear ambitions and in return economic sanctions would be eased. The International Energy Agency estimates that Iran could raise production by between 600,000 and 800,000 barrels a day within months of sanctions being lifted. Iran says it can raise exports by 500,000 barrels a day as soon as sanctions are lifted, then an additional 500,000 a day in the following six months. So far this year, it has produced an average of 2.8 million barrels a day. Sanctions will not be lifted until at least December. That is when the United Nations monitors report on Iran’s compliance with the deal.
But markets are not going to wait. After having faced stiff resistance at 61-62 for over a month and a half, the spot West Texas Intermediate crude lost support at 58 on July 1, and then proceeded to lose crucial support at 54 two weeks ago. This week, it lost another four percent. Are the lows of January and March in play?
Non-commercials cut back net longs, and have been doing so for a while since the high eight weeks ago. The longer the WTI stays below 54, the more the pressure to unwind these longs.
Currently net long 279.4k, down 35.1k.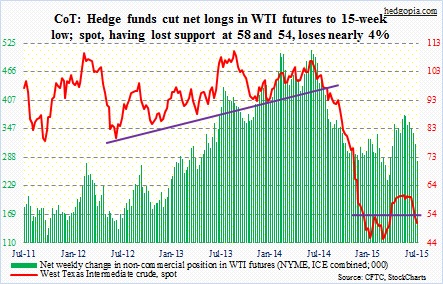
E-mini S&P 500: It was a ho-hum week in the markets, with the S&P 500 up 2.4 percent. This was despite the fact that in the July 15th week $2.9 billion left domestic equity funds (courtesy of Lipper). In the July 8th week, funds specializing in U.S. shares attracted $12.6 billion. For the rally to continue, more inflows are needed, not outflows.
There is caution in the air. Bank of America Merrill Lynch surveyed nearly 200 managers in the week ended July 9 and found that cash levels rose to 5.5 percent – a level not seen since December 2008. This potentially is a contrarian signal. But would these pros start buying near/at all-time highs or are they waiting for better opportunities? The average exposure of National Association of Active Investment Managers members to U.S. stocks currently stands at 52.2 percent, down from 90.6 percent toward the end of April.
Similarly, Investors Intelligence’s bulls’ reading dropped to 43.7 percent, versus 57.4 percent toward the end of April; those expecting correction rose to 40.7 percent – the highest reading since 46.5 percent on October 21st. We know what happened back then. Stocks bottomed on the 15th of that month. As well, the American Association of Individual Investors’ neutral reading has been stuck in the 40s for the past 15 weeks.
Will the bulls be able to cash in on this caution? Short interest remains high. Or will market participants begin to now focus on the VIX, which has now collapsed below 12 – again?
Having raised net shorts to a three-plus-year high last week, non-commercials cut back by 25 percent. They probably got squeezed. This remains an opportunity for the bulls – let us see if they continue to deliver. The difficulty they face is this. Daily momentum indicators on S&P 500 are now getting overbought. From intra-day low to high, the index has rallied 4.2 percent in nine sessions!
Currently net short 135.1k, down 45.4k.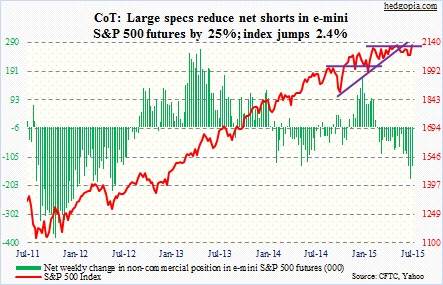
Euro: The Greek parliament approved the measures needed to get its third bailout. This was followed by the ECB increasing emergency lending to Greek banks, which have remained closed for more than two weeks. Now that Greece is “fixed”, a question arises as to if a eurozone with Greece is good or bad for the euro. If not for countries in the periphery, and issues that are born thereof, the euro would probably be a lot stronger – not good for exports-reliant Germany.
Is this beginning to sink in among traders? The currency lost 2.8 percent for the week. One would think it would rally now that the Greek can has been kicked down the road.
The bigger question is, does the new bailout program put Greece on a sustainable path of growth or overburden it with debt? In due course, Greece, and the headline risk associated with it, will reappear.
Currently net short 107.8k, up 8.5k.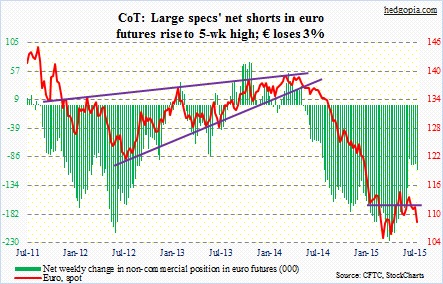
Gold: China increased its gold reserves to 1,658 metric tons – the fifth largest hoard globally. This is the first time since 2009 it has reported gold holdings. Back then, China held 1,054 metric tons. The U.S. has the largest reserves at 8,133.5 metric tons. So from this perspective China has a ways to go. But it does have ambition to raise the status of renminbi as a reserve currency. Gold helps toward that goal. For years, speculation was rife that China had been accumulating gold. Turns out it was indeed doing that. Was the market expecting more?
Gold continues to fail to attract bids. Greece did not help. And Chair Yellen’s interest-rate commentary this week did not either. Add to that a strong dollar.
The yellow metal has lost crucial support at 1,140 and is a couple of dollars away from the November 2014 low of 1,130.40. This is not looking good for gold bugs. They sure hope non-commercials would stop unwinding net longs – currently at a 77-week low.
Currently net long 47.8k, down 2.6k.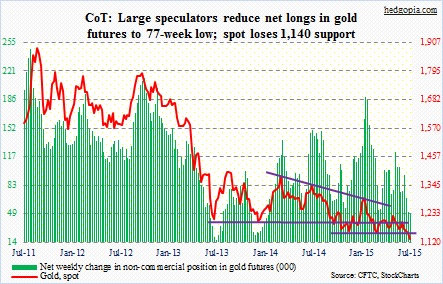
Nasdaq 100 index (mini): The index broke out – to a new all-time high – rallying 5.5 percent for the week. Apple (AAPL) jumped a little less – 5.1 percent. Google (GOOG) was the star – surging 16.1 percent on Friday post-earnings, and 27 percent for the week.
Non-commercials were well-positioned for this. By Tuesday, they had raised net longs by 90 percent to a three-week high.
Currently net long 54.9k, up 26k.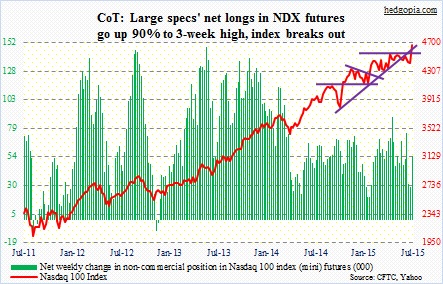
Russell 2000 mini-index: RVX, the Russel 2000 Volatility Index, collapsed north of 25 percent for the week – near nine-year lows. As well, the Russell 2000 is right underneath four-month resistance at 1270ish. A month ago, it suffered a false breakout. Kudos to the bulls for being able to once again attack that resistance. The question is, will they succeed this time? For the week, small caps grossly underperformed, with the Russell 2000 up only l.2 percent, half that of the S&P 500. Sectors such as consumer discretionary broke out.
Non-commercials are essentially indifferent. They are net short, but not by much.
Currently net short 7.5k, up 1.3k.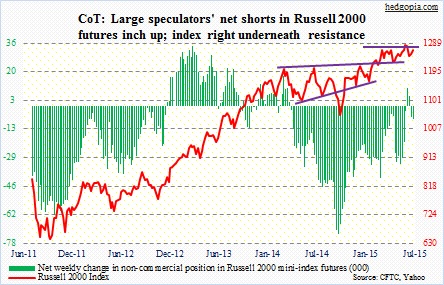
U.S. Dollar Index: It had a strong week – up 1.9 percent. On a weekly chart, there is room to move higher still. But on a daily basis, conditions are overbought, and it is currently rising along the upper Bollinger band.
In the past month, the index has rallied five percent. During the period, non-commercials’ net long went up 10 percent – decent but not overly aggressive. In the latest week, holdings were essentially flat. These traders need to be building positions with aggression, as they were in the early months of the year, for the buck to rally further.
In the near-term, the path of least resistance is probably down.
Currently net long 58.7k, down 728.
VIX: In two weeks, spot VIX has deflated north of 40 percent – down 29 percent this week alone. Last week, there were several sessions of backwardation. This week, contango is in full force. As a result, shorter-term volatility has just collapsed.
Over the years, VIX has time and again flashed a spike buy signal, in which it spikes, only to quickly retreat. This was evident the last couple of weeks on a weekly chart. Now that VIX has cratered, what next? It is at/near the lower end of the range it has been in.
Non-commercials did raise net shorts by 41 percent. Although it must be pointed out that this was as of Tuesday, when spot VIX closed at 13.37. By Friday, VIX was down 11 percent. So it is possible these traders took chips off the table. We will find out.
Currently net short 31k, up 9k.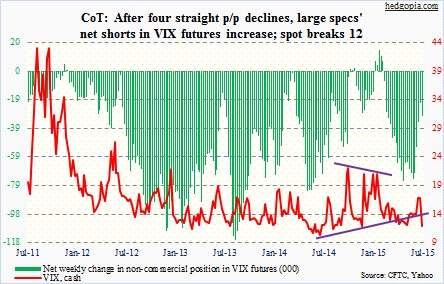
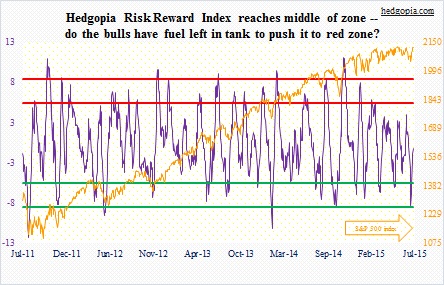
Hedgopia Risk Reward Index