
Following futures positions of non-commercials are as of Aug 8, 2017.
10-year note: Currently net long 229.8k, up 19k.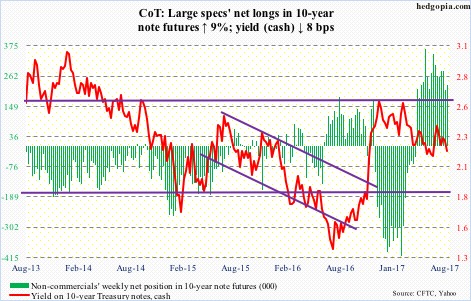
In the past several months, several Fed officials, including Chair Janet Yellen, have expressed concern over persistently rising stock-market valuations.
Using trailing 12-month numbers, the S&P 500 large cap index trades at 21 times operating and 23 times reported earnings – historically very high.
Off this week’s all-time high, the index is down two percent. Ten-year yields are under pressure again.
How far do stocks have to drop before FOMC members are comfortable with valuations?
Even more important, in the event of a correction, at what point would they start worrying? If stocks proceed to drop double digits, would they try to intervene – not only verbally but by action? The way they did with quantitative easing in the prior downturn. The Ben Bernanke-led Fed extolled the virtues of wealth effect. This Fed is probably no different.
30-year bond: Currently net long 76.6k, up 27.8k.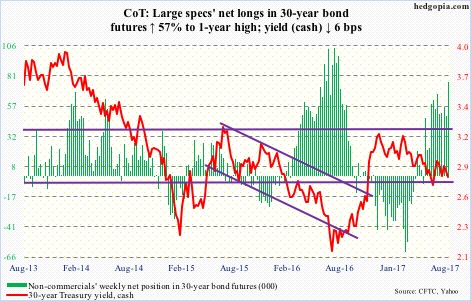
Major economic releases next week are as follows.
Tuesday brings retail sales (July), the NAHB housing market index (August), and the Treasury International Capital data (June).
Retail sales fell 0.2 percent month-over-month in June to a seasonally adjusted annual rate of $473.5 billion. Sales decelerated to growth of 2.9 percent year-over-year – from January’s 5.6-percent pace.
Builder sentiment dropped two points m/m in July to 64. Sentiment has been under pressure since reaching 71 in March this year, which was the highest since June 2005.
Foreigners of late have been accumulating U.S. equities. Year-to-May, they net-purchased $57.8 billion worth. On a 12-month rolling total basis, purchases totaled $91.1 billion in May. In February last year, they were selling $142 billion worth – a record.
Housing starts (July) and FOMC minutes (July 25-26 meeting) are due out Wednesday.
Starts jumped 8.3 percent m/m in June to 1.22 million units (SAAR). This followed three consecutive monthly declines. Starts peaked at 1.33 million last October – the highest since August 2007.
Industrial production (July) is published on Thursday. June was up two percent y/y. This was the sixth up month in seven after 20 straight y/y contraction.
August’s preliminary numbers for the University of Michigan’s consumer sentiment index are scheduled for Friday. Sentiment fell 1.7 points m/m to 93.4. Post-election, sentiment peaked at 98.5 in January – a 13-year high.
Crude oil: Currently net long 475.2k, down 22.8k.
The trend line from February this year continued to resist rally attempts. After several sessions of lingering around the 200-day moving average, spot West Texas Intermediate crude ($48.82) lost the average on Thursday when it got punished for a two-percent drop.
The daily chart seems to want to go lower. The 50-day lies at $46.47/barrel, and before that rests horizontal support at $47.
Wednesday’s EIA report contained more good than bad, but that was no help.
For the week ended August 4, crude stocks fell 6.5 million barrels to 475.4 million barrels. From the all-time high 535.5 million barrels in the March 31st week this year, stocks are now down 60.1 million barrels.
That said, gasoline stocks jumped 3.4 million barrels to 231.1 million barrels – a three-week high. Distillate stocks, however, dropped 1.7 million barrels to 147.7 million barrels, a 10-week low.
Refinery utilization rose nine-tenths of a point to 96.3 percent. This was the highest since August 2005.
Crude imports declined 491,000 barrels/day to 7.76 million b/d – a four-week low.
Crude production inched down 7,000 b/d to 9.42 mb/d. The prior week was a two-year high. Since OPEC reached an agreement to cut back production by 1.8 mb/d last November, U.S. production has gone up by 724,000 b/d.
In the meantime, OPEC’s July output rose by 173,000 b/d to nearly 32.9 mb/d. This was the highest level since last December, just a month before the planned cut started in January. Libya and Nigeria, which are exempt from the agreement, were the main culprits.
E-mini S&P 500: Currently net long 77k, down 2.6k.
An extended market used Kim Jong-un as an excuse to unwind overbought conditions.
Thursday’s 1.5-percent drop on the cash (2441.32) pushed it below the 50-day; 2463 is the new resistance. The all-time high of 2490.87 on August 8 has the makings of a major top. We will see.
Down below, there is decent support at just north of 2400. Near term, should the price get there, it likely holds, duration and extent notwithstanding. The daily chart is getting oversold.
Remains to be seen if flows cooperate. In the week ended Wednesday, SPY (SPDR S&P 500 ETF) lost $500 million. But this was offset by inflows into VOO (Vanguard S&P 500 ETF) and IVV (iShares core S&P 500 ETF) – $282 million and $125 million, respectively (courtesy of ETF.com).
In the same week, U.S.-based equity funds lost another $2.8 billion – $6.9 billion in the last four (courtesy of Lipper).
Euro: Currently net long 93.7k, up 11k.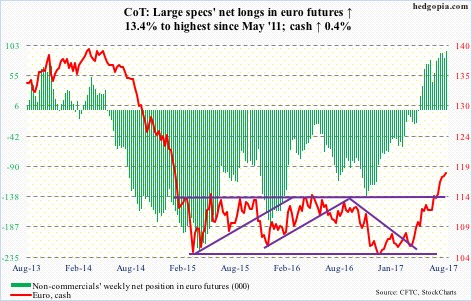
After last week’s weekly shooting star near multi-year resistance at 119, the cash (118.21) this week did fail to make a higher high, but did not close under last week’s close. So no confirmation. That said, this week’s candle has the look of a hanging man.
It is healthy if the euro trades back down to retest the recent break out of 114.50-ish. The 50-day (114.61) lies right there.
Gold: Currently net long 148.8k, up 19.2k.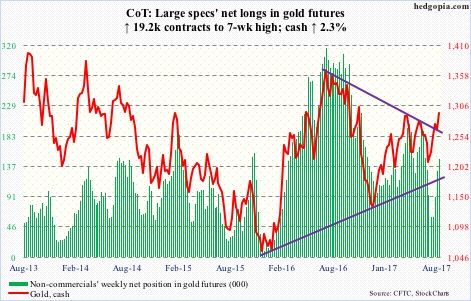
After the 50-day was defended Tuesday in a long-legged doji session, the cash ($1,294/ounce) quickly proceeded to test resistance at $1,300. For the past several years, this has proven to be important resistance. A breakout would suggest a shifting sentiment toward risk-haven assets.
That said, at least until Wednesday, GLD (SPDR gold ETF) failed to catch traders’ fancy. In the week through that session, the ETF lost $193 million (courtesy of ETF.com). In the last nine sessions, that was the only session GLD saw any activity.
Nasdaq 100 index (mini): Currently net long 43k, down 12.8k.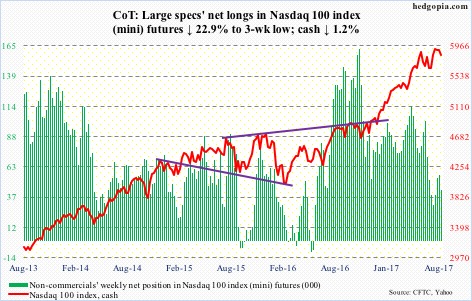
Like the S&P 500, the cash (5831.53) lost the 50-day on Thursday. But unlike the S&P 500, the Nasdaq recaptured the average in the very next session.
Be that as it may, the Nasdaq 100 failed to make a new high on August 8. The all-time high of 5995.77 on July 27 stands, and that was a huge bearish engulfing session.
Both weekly and monthly indicators are turning down. This is an opportunity for the bears, and they are positioned.
Short interest on XLK (SPDR technology ETF) and the Nasdaq composite remains high. In due course, this in and of itself can contribute to creating a floor, as short-covering takes place.
Near-term, there is support at 5570, and after that 5450.
In the week through Wednesday, QQQ (PowerShares Nasdaq 100 ETF) took in $300 million. This followed outflows of $3.5 billion in the prior two (courtesy of ETF.com).
Russell 2000 mini-index: Currently net short 49.6k, up 6.2k.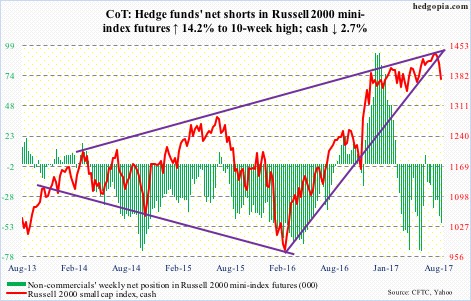
July was a spinning top on the cash. Last week, the Russell 2000 lost a rising trend line from February last year. This preceded failed breakout attempts throughout this year at a three-year-old rising wedge.
This week, the index fell apart, losing the 50-day and dropping back into a months-long rectangle between 1340s and 1390s.
Friday, it tested the 200-day, and it held. There is room for a relief rally near term.
In the week to Wednesday, IWM (iShares Russell 2000 ETF) attracted another $484 million – following inflows of $2.1 billion in the prior week – but these longs are now under water (courtesy of ETF.com).
US Dollar Index: Currently net short 2.7k, up 1.1k.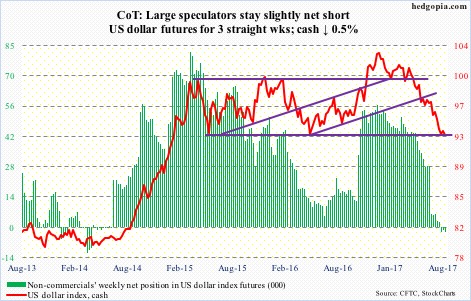
The cash (92.96) continues to struggle to hammer out a bottom. This week’s geopolitical developments and the resultant inflows into “safe-haven” Japanese yen notwithstanding, the US dollar index remains in damage-repair mode as long as the August 2nd low of 92.39 holds.
Support at 92-plus goes back to at least 1998.
VIX: Currently net short 155k, down 3.1k.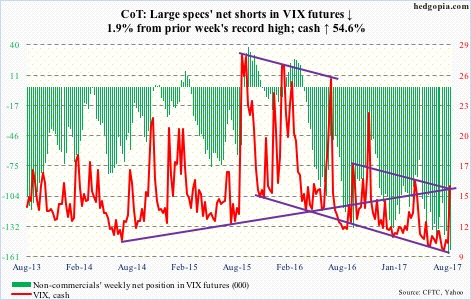
Stretched rubber bands are packed with energy. We saw this unfold in the cash this week. From an all-time low 8.84 on July 26 to 17.28 on August 11 – doubled in 13 sessions.
Leading up to this, as of July-end, volatility bears had built record short interest in VXX (iPath S&P 500 VIX short-term futures ETN). And non-commercials last week had record net shorts in VIX futures.
Volatility this week likely benefited from short squeeze. VIX (15.51) is past both 50- and 200-day, with both slightly turning up.
Near term, though, the daily chart is looking extended, and VIX could be headed lower. Intraday Friday, the VIX-to-VXV ratio jumped to 1.03 – into overbought territory – before backing off.
Thanks for reading! Please share.
