
Following futures positions of non-commercials are as of Aug 15, 2017.
10-year note: Currently net long 200.6k, down 29.2k.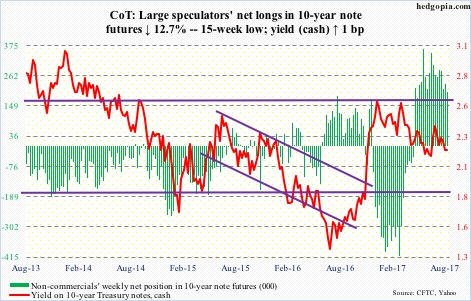
The annual Jackson Hole economic policy symposium – slated for August 24-26 this year – is known for its news-making potential.
In 2012, Ben Bernanke, then-Fed chair, used the venue to make a strong case for QE3, moving the markets the following week.
In 2014, Mario Draghi, ECB president, laid the foundations for asset purchases/QE. That was the last time he attended Jackson Hole. He is attending this year. This had given rise to expectations that he would announce some important policy decision.
On Wednesday, however, several news outlets carried news citing sources that Mr. Draghi would not deliver a new policy message. (Less than two weeks after Jackson Hole, the ECB’s governing council meets.)
Ditto with Janet Yellen, Fed chair. The July 26th FOMC statement already mentioned that “the committee expects to begin implementing its balance sheet normalization program relatively soon…”
Bottom line, this year’s Jackson Hole is less likely to surprise the markets.
30-year bond: Currently net long 73.5k, down 3.1k.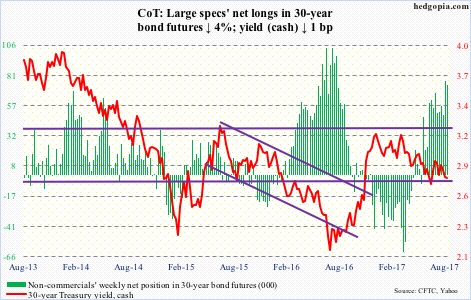
Major economic releases next week are as follows.
July’s new home sales are on tap for Wednesday. Sales inched up 0.8 percent in June to a seasonally adjusted annual rate of 610,000 units. The cycle high 638,000 units was reached in March this year; this was the highest since November 2007.
Thursday brings existing home sales for July. June dropped 1.8 percent m/m to 5.52 million units (SAAR). March’s 5.7 million units were the highest since February 2007.
Orders for non-defense capital goods ex-aircraft – proxy for business capital expenditures – for July are scheduled for Friday. June was flat m/m at $63.5 billion (SAAR); y/y, orders were up 5.8 percent – the fifth straight y/y increase. Orders peaked at $70.3 billion in September 2014.
Crude oil: Currently net long 453.3k, down 21.9k.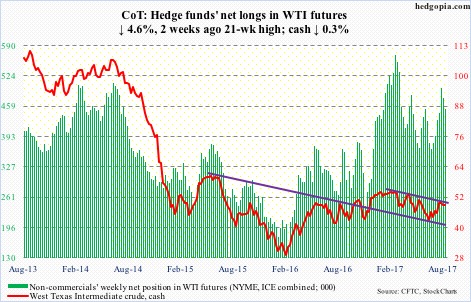
After having been rejected at the 200-day moving average last week, spot West Texas Intermediate crude ($48.66/barrel) quickly dropped this week to test the 50-day – successfully.
On the weekly chart, there is still room for the crude to continue lower, but the daily is itching to once again go test the 200-day ($49.42).
In the latest week, the weekly EIA report contained more negatives than positives.
For the week ended August 11, crude stocks dropped by another 8.9 million barrels to 466.5 million barrels. From the all-time high 535.5 million barrels in the March 31st week this year, stocks are now down 69.1 million barrels.
Gasoline stocks, however, inched up 22,000 barrels to 231.1 million barrels. Distillate stocks rose by 702,000 barrels to 148.4 million barrels.
Crude stocks, too, increased – by 364,000 barrels/day to 8.1 million b/d, even as refinery utilization inched down two-tenths of a point to 96.1 percent. In the prior week, utilization was the highest since August 2005.
Crude production expanded by 79,000 b/d to 9.5 mb/d. Since OPEC reached an agreement to cut back production by 1.8 mb/d last November, U.S. production has gone up by 803,000 b/d.
E-mini S&P 500: Currently net long 150.2k, up 73.2k.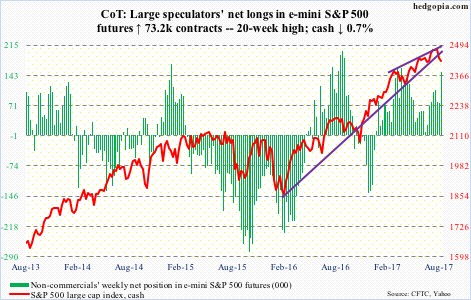
Right on cue, bears showed up near resistance on the cash. The brief relief rally early this week was used as an opportunity to short/sell.
In fact, by Wednesday the S&P 500 rallied to 2474.93 intraday, past resistance at 2463. But there was no conviction behind the move as that session itself ended in a long-legged doji. Thursday, the index dropped 1.5 percent, slicing through the 50-day.
Support at 2400 goes back six months. It was last tested early July. The bulls cannot afford to lose it, and they will need flows to cooperate.
In the week through Wednesday, that was not the case. SPY (SPDR S&P 500 ETF), VOO (Vanguard S&P 500 ETF) and IVV (iShares core S&P 500 ETF) all saw redemptions – $292 million, $907 million and $24 million, respectively.
In the same week, U.S.-based equity funds lost another $5.9 billion – $12.8 billion in the last five (courtesy of Lipper).
Euro: Currently net long 79.3k, down 14.4k.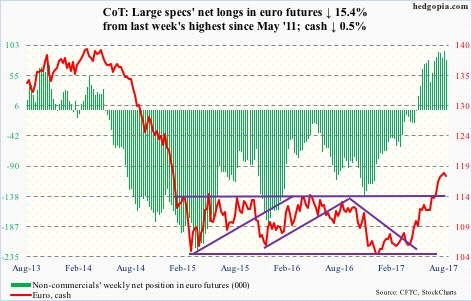
Rally attempts are beginning to get sold near shorter-term moving averages, but euro bulls are not giving up that easy.
This week’s 0.5-percent drop on the cash (117.60) was preceded by a weekly hanging man last week and a shooting star before that.
The euro has been under pressure since rallying to 119.09 on August 2. Resistance at 119 goes back multiple years.
The 50-day lies at 115.10, and below that 114.50-ish. The latter is important as this has proven to be an important level going back multiple years.
Gold: Currently net long 187.7k, up 38.9k.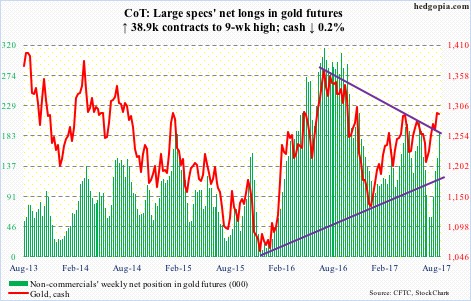
Finally some inflows into GLD (SPDR gold ETF).
After eight consecutive weeks of withdrawals totaling $2.7 billion, the ETF gained $352 million in the week to Wednesday (courtesy of ETF.com).
This was enough to defend the 10- and 20-day – both rising – on the cash ($1,291/60/ounce), and to once again test resistance at $1,300/ounce. This resistance goes back several years, and has repelled breakout attempts six times in the past four months.
Nasdaq 100 index (mini): Currently net long 47.2k, up 4.2k.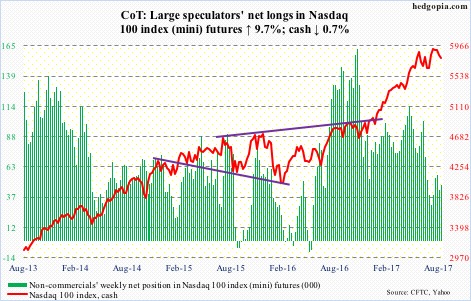
Since July 27, when the cash (5790.91) rallied to a new high 5995.77 but only to see it reverse in a bearish engulfing session, the Nasdaq 100 has made lower highs, including a long-legged doji session Wednesday. Thursday, the bulls were punished for a 2.1-percent drop, losing – for the second time in six sessions – the 50-day.
The tech-heavy index has led this year. The problem is that the leading names such as Apple (AAPL), Microsoft (MSFT), Alphabet (GOOGL), Amazon (AMZN) and Facebook (FB) are primarily responsible for the move.
A ratio between QQEW (First Trust Nasdaq 100 equal-weighted index) and QQQ (PowerShares QQQ trust) is at a 17-year low. Underneath the surface, there is weakness.
Near-term, there is support at 5570, and after that 5450. The latter in particular is important.
In the week through Wednesday, QQQ (PowerShares Nasdaq 100 ETF) took in another $130 million. This followed inflows of $300 million in the prior week (courtesy of ETF.com).
Russell 2000 mini-index: Currently net short 79.6k, up 30k.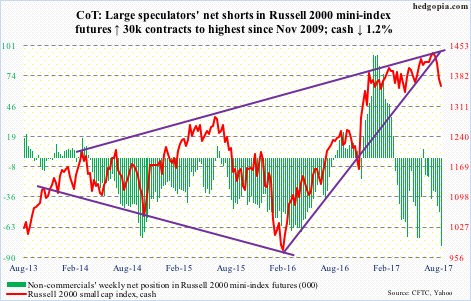
Merely four sessions after successfully testing the 200-day, the cash (1357.79) lost the average Thursday. This was the first time the Russell 2000 traded below the average since June last year.
The index has lost a rising trend line from February last year, as well as dropped out of a rising wedge going back several years.
With this, the Russell 2000 is now back into a months-long rectangle between 1340s and 1390s.
In fact, after last week’s decline, it opened the week with a 1.5-percent rally on Monday. Tuesday, bears showed up at 1396. The good thing for the bulls is that in a long-legged doji session Friday they were able to defend the lower bound. The 200-day at 1375.27 is the nearest hurdle.
In the week to Wednesday, IWM (iShares Russell 2000 ETF) lost $626 million. This followed inflows of $2.6 billion in the prior two (courtesy of ETF.com).
US Dollar Index: Currently net short 2.1k, down 560.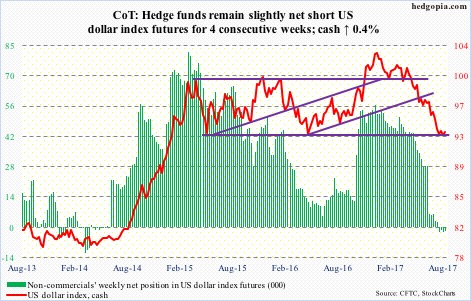
Since it dropped to 92.39 on August 2, the cash (93.36) has printed higher lows. Support at 92 goes back to at least 1998.
That said, dollar bulls have been unable to take out near-term resistance at 93.65. On Tuesday-Thursday, the US dollar index rallied to 94 or higher intraday only to give back all or most of the gains.
As a result, since the afore-mentioned low, the index has been caught in what looks like a bear flag, with the daily chart a little extended.
Non-commercials continue to show disinterest.
The index remains in damage repair mode so long as the August 2nd low is not violated.
VIX: Currently net short 129.4k, down 25.6k.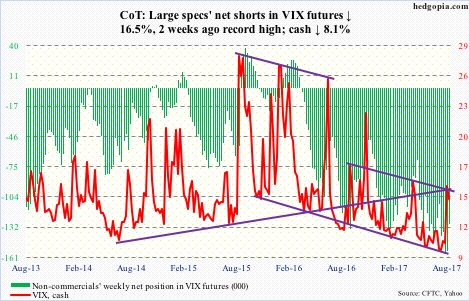
Volatility bulls defended the 200-day (11.92) on the cash.
VIX (14.26) started the week at 15.51, dropped to 11.25 by Wednesday before rallying to 15.55 on Thursday. Volatile!
Even after the recent jump in VIX, the volatility curve – VXST (nine days), VIX (30 days), VXV (90 days) and VXMT (six months) – is still in contango, with the spread between VXST and VXMT -3.21 points.
Several times in the past, a tradable bottom in stocks came about after the curve dropped into backwardation where VXST was five to seven points wider than VXMT.
That said, near term it is possible VIX goes on to once again test the 200-day.
Thanks for reading!
