
Following futures positions of non-commercials are as of Nov 21, 2017.
10-year note: Currently net long 111.1k, up 36.2k.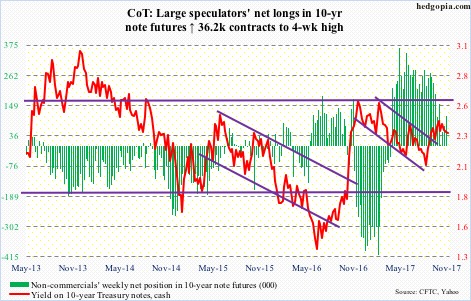
“In light of elevated asset valuations and low financial market volatility, several participants expressed concerns about a potential buildup of financial imbalances. They worried that a sharp reversal in asset prices could have damaging effects on the economy.”
You cannot have your cake and eat it too. The Fed, it seems, is trying to have it both ways.
The above quotation is from the October 31-November 1 FOMC minutes released last week. It is clear members are worried about elevated multiples in equities. This is not the first time. Janet Yellen, outgoing Fed chair, herself has several times in the past brought up the topic.
Markets are not a least bit worried. They have a reason not to. The second sentence in the above quotation says it all. Even as the Fed sounds worried about elevated valuations, it continues to leave interest rates at very accommodative levels – married to the concept of wealth effect and all.
The result? On a trailing 12-month basis, the S&P 500 large cap index is trading at well north of 21x, with the potential to get even more expensive – unless the Fed puts money where its mouth is.
30-year bond: Currently net long 59.7k, up 14.6k.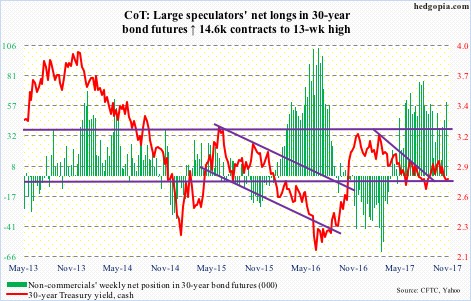
Major economic releases the rest of the week are as follows.
The S&P Corelogic Case-Shiller home price index for September is due out later this morning. Nationally, home prices in September rose 6.1 percent year-over-year. This was the highest growth rate since 6.3 percent in June 2014. Prices have risen well north of consumer inflation for a while now.
Wednesday brings GDP (3Q17, 2nd estimate), corporate profits (3Q17, 1st estimate) and pending home sales (October).
The advance estimate showed real GDP advanced at a seasonally adjusted annual rate of three percent in 3Q17, following 3.1 percent in 2Q17. This was the first time since 2Q-3Q14 that the economy grew with at least a three handle in back-to-back quarters.
In 2Q17, corporate profits with inventory valuation and capital consumption adjustments increased 6.4 percent y/y to $2.12 trillion (SAAR). This was the third consecutive y/y increase after five quarters of contraction. Profits peaked at $2.23 trillion in 4Q14.
Pending home sales in September were flat month-over-month at 106. The cycle high 113.6 – as well as a 10-year high – was reached in April last year.
Personal income and outlays for October is scheduled for Thursday. Core PCE (personal consumption expenditures) rose 1.33 percent y/y in September. This is the Fed’s favorite measure of consumer inflation, and has been sub-two percent since May 2012. The closest it came was last October when prices rose 1.92 percent.
November’s ISM manufacturing index comes out Friday. Manufacturing activity contracted 2.1 points m/m in October, but September’s 60.8 was the highest since 61.4 in May 2004.
Crude oil: Currently net long 611.5k, down 7.7k.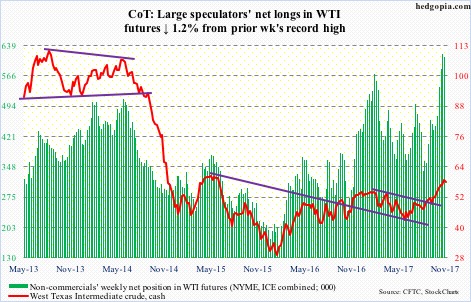
OPEC meets on the 30th. The existing deal to cut production expires next March. Markets expect an extension.
In the meantime, TransCanada (TRP) is cutting deliveries by at least 85 percent on its 590,000-barrel-per-day Keystone crude pipeline through the end of the month. The pipeline was shut last week due to a spill in South Dakota.
Oil bulls kept up the pressure last week on spot West Texas Intermediate crude ($58.11/barrel).
The risk facing them is either OPEC fails to deliver later this week or even if it delivers, the ‘buy the rumor, sell the news’ phenomenon sets in. The $54-55 level has decent support. The bears first need to take out $57.60.
The EIA report for the week of November 17 was a mixed bag.
Crude production continued to rise, up 13,000 b/d to 9.66 million b/d.
Both gasoline and distillate stocks rose, up 44,000 barrels and 269,000 barrels to 210.5 million barrels and 125 million barrels, respectively.
Crude stocks, however, fell 1.9 million barrels to 457.1 million barrels. As did crude imports, which dropped 25,000 b/d to 7.87 mb/d.
Refinery utilization inched up three-tenths of a point to 91.3 percent.
E-mini S&P 500: Currently net long 124.2k, down 28.4k.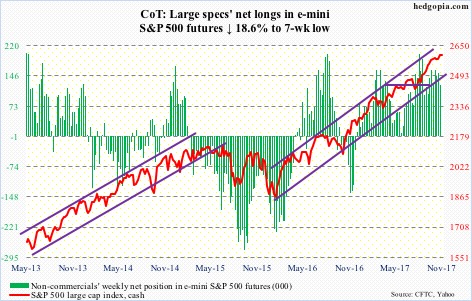
After defending support at 2566 (cash) several times this month, the bulls have proven they still have the wherewithal left to keep the momentum going.
Last week, SPY (SPDR S&P 500 ETF) took in $3.1 billion (courtesy of ETF.com). Another $85 million flowed into VOO (Vanguard S&P 500 ETF) and $847 million into IVV (iShares core S&P 500 ETF).
Also last week, in the week through Wednesday, U.S.-based equity funds attracted $5.9 billion. In the last seven, inflows have totaled $27 billion (courtesy of Lipper).
The S&P 500 rallied 0.9 percent last week to a fresh high.
The daily chart is beginning to look extended, however. In the event of downward pressure, the afore-mentioned support is worth watching.
Euro: Currently net long 95.4k, up 10.9k.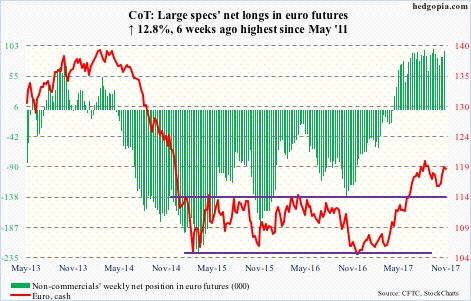
In a classic example of oversold ‘weekly’ versus overbought ‘daily’, the former won out on the cash ($118.98). At the beginning of last week, it looked like the ‘daily’ was itching to unwind its overbought condition. But the bulls defended the 10-day moving average – followed by a rally past the 50-day as well as short-term resistance at $118.60. The latter likely gets tested soon.
The euro peaked on September 8 at $120.69. If ‘weekly’ continues to prevail, what happens at that level will have significance. This resistance goes back nearly two decades.
Gold: Currently net long 201.8k, up 6.7k.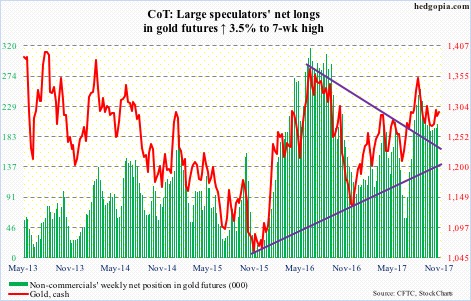
Flows continue to disappoint the gold bugs.
For nine sessions ended last Friday, GLD (SPDR gold ETF) saw no activity whatsoever. IAU (iShares gold trust), however, managed to attract $106 million last week (courtesy of ETF.com).
This is reflected in how the cash ($1,294.4/ounce) is behaving.
The bulls have done a great job of defending the 200-day ($1,266.69), but at the same time have struggled to bolt past the 50-day ($1,286.56), which was defended yesterday.
There is plenty of room to rally on the weekly chart if resistance at $1,300 gets taken out.
Nasdaq 100 index (mini): Currently net long 15.7k, down 11.9k.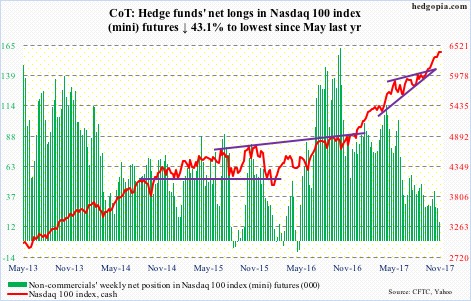
In a holiday-shortened, low-volume week, the cash (6405.97) rallied another 1.5 percent last week to a new high.
That said, QQQ (PowerShares QQQ trust) lost $961 million last week (courtesy of ETF.com). Non-commercials continue to cut back net longs.
Nearest support lies at 6350, which approximates the 10-day.
Worth watching: the daily Bollinger bands are contracting, with the Nasdaq 100 finding resistance at the upper bound the past couple of sessions.
Russell 2000 mini-index: Currently net short 5.9k, down 5.7k.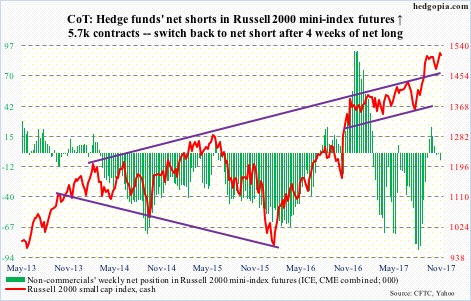
Last Tuesday, the cash (1513.31) rallied past resistance at 1515 to a new high – albeit rather feebly.
For weeks, the Russell 2000 lagged large-cap peers. Then it rallied 4.8 percent intraday between the 15th and 22nd this month – in six sessions.
Flows are cooperating. Last week, ETF.com shows $627 million moved into IWM (iShares Russell 2000 ETF) and $201 million into IJR (iShares core S&P small-cap ETF).
Non-commercials, however, were not buying into last week’s breakout. Their holdings are as of last Tuesday, when the afore-mentioned breakout took place. The breakout also put the cash into overbought territory.
The bulls need to defend 1480-85. Right above, there is a cluster of moving averages, including the 50-day (1490.70).
US Dollar Index: Currently net short 6.6k, up 3.8k.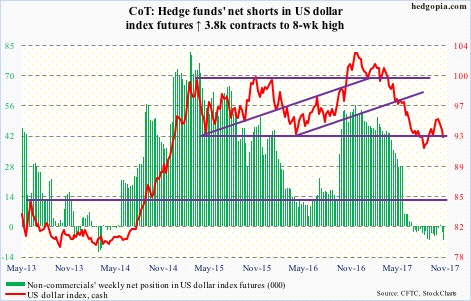
The 50-day has been lost on the cash (92.82). Ditto with 93.
The US dollar index is at a crucial juncture – sort of a make-or-break.
Beginning March 2015, it pretty much remained range-bound between 100-101 and 92-93, until it broke out last November, which, it turns out, was false.
The fact that it is once again testing the lower end speaks of the woes it finds itself in. If ‘weekly’ exerts control, it can continue lower. On September 8, it bottomed at 90.99, and that low has taken on significance.
Non-commercials continue to show disinterest.
VIX: Currently net short 103k, down 24.7k.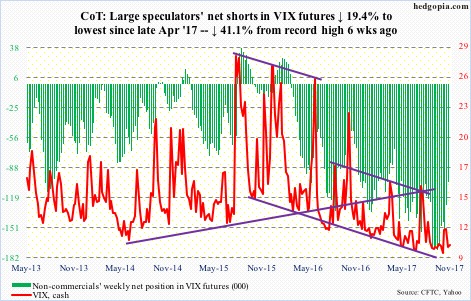
Last Friday was historic. The cash (9.87) dropped to a new intraday low of 8.56, before bouncing off of the lower Bollinger band to end the session down 0.23 to 9.65. It was a hammer reversal. Several times going back at least four months, VIX has found support at the lower Bollinger band, which subsequently led to spikes, although they did not last very long. Be that as it may, nimble traders can take advantage.
As things stand, volatility remains suppressed. The volatility curve – VXST (measures expectations of nine-day future volatility in the S&P 500)-VIX (30 days)-VXV (90 days)-VXMT (six months) – is in contango, and the VIX-to-VXV ratio has languished between mid- to high-0.70s and low-0.80s in the last 14 weeks.
Thanks for reading!
