
Following futures positions of non-commercials are as of December 19, 2017.
10-year note: Currently net short 44.2k, down 89k.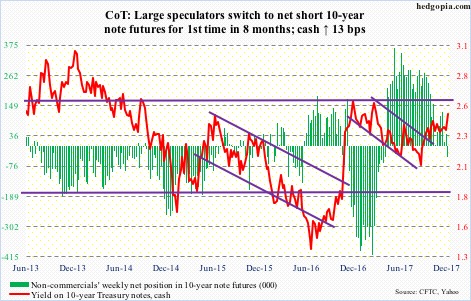
Is the big one around the corner? The big breakout, that is?
Ten-year Treasury yields, at one point at 2.5 percent, closed out the week at 2.49 percent. It was quite a rally. The weekly high just about kissed the upper end of a three-decade-old channel.
A breakout here will be massive, with repercussions across asset classes as well as economies.
Because it is a descending channel, with the passage of time, the level where a breakout occurs, continuously declines. In March this year, it was just north of 2.6 percent. This was also a level – 2.62 percent, to be precise – reached last December, and unsuccessfully tested in March this year.
Back in January this year, Bill Gross, of Janus Henderson, said that if 2.6 percent was breached, bad things would happen in the fixed income market, essentially saying this would signify the end of the long bull market in bonds.
Now, in order to test that resistance, bond bears would have to first force a channel breakout, which, should it occur, will be a major development.
If the bears are serious this time around, the most likely path for now is for these yields to go back down and hold support. The 50-day, for instance, is at 2.37 percent. This would give them an opportunity to reload. At the lows this week, TLT (iShares 20+ year Treasury bond ETF) was down 3.4 percent, and a pause is only natural.
30-year bond: Currently net long 104.3k, up 3.4k.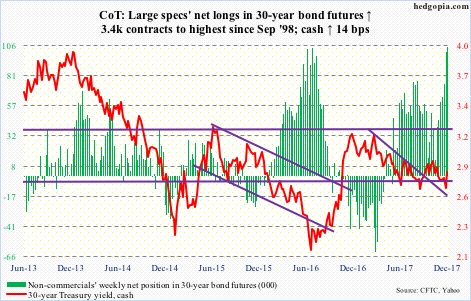
Major economic releases next week are as follows. Happy Holidays!
On Wednesday, the S&P Corelogic Case-Shiller home price index for October and the pending home sales index for November will be published.
Nationally in September, home prices rose 6.2 percent year-over-year. This was the highest growth rate since rising 6.3 percent in June 2014. The last time prices fell y/y was in April 2012.
Pending home sales, which lead sales of existing homes, rose 3.7 points month-over-month in October to 109.3 – a four-month high. In November, existing home sales rose 5.6 percent m/m to a seasonally adjusted annual rate of 5.81 million units, which were the highest since December 2006.
Crude oil: Currently net long 636.8k, down 17.1k.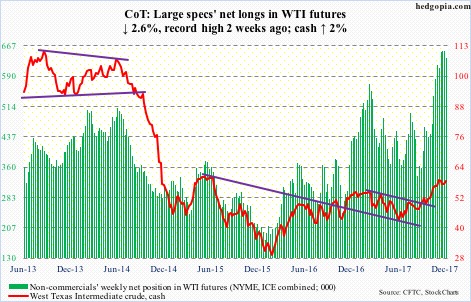
Thus far, the bull-bear tug of war around shorter-term moving averages on spot West Texas Intermediate crude ($58.47/barrel) has gone the bulls’ way. For the last several weeks, they have also successfully defended resistance-turned-support at $54-55.
November’s all-time high of $59.05 is a stone’s throw away. As is the daily upper Bollinger band at $58.77. These bands are once again narrowing. A sharp move is likely upon us.
On the weekly chart, a pennant has formed. Can non-commercials contribute toward a breakout? They are already aggressively long.
In the meantime, the EIA report for the week of December 15 showed momentum continued to build in U.S. crude production, which rose 9,000 barrels/day to 9.79 million b/d. Since OPEC and Russia reached a deal in November last year to cut production by 1.8 mb/d, U.S. production has gone up by 1.09 mb/d.
Gasoline stocks rose, too, up 1.2 million barrels to 227.8 million barrels. As did distillate stocks – up 769,000 barrels to 128.8 million barrels.
Crude imports increased as well – up 471,000 b/d to 7.83 mb/d.
Crude stocks on the other hand dropped 6.5 million barrels to 436.5 million barrels. This was the lowest since October 2015.
Refinery utilization inched up seven-tenths of a point to 94.1 percent.
E-mini S&P 500: Currently net long 83.2k, up 15.4k.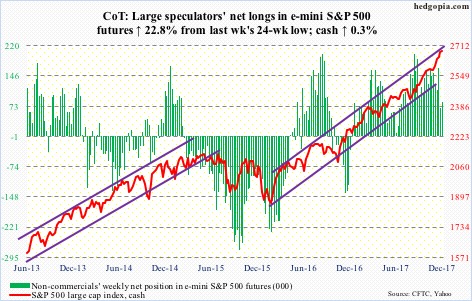
Flows continue to diverge. In the week through Wednesday, U.S.-based equity funds lost $22.2 billion. This followed outflows of $16.2 billion in the prior week. The two-week withdrawal of $38.4 billion was more than $32.4 billion these funds took in the prior nine (courtesy of Lipper).
Contrast this with healthy inflows into S&P 500-focused ETFs. In the same week, SPY (SPDR S&P 500 ETF) attracted $4.2 billion, and VOO (Vanguard S&P 500 ETF) $372 million. IVV (iShares core S&P 500 ETF), however, lost $1.4 billion. In the past three weeks, $21.1 billion moved into SPY (courtesy of ETF.com).
The cash gapped up Monday to a new intraday high of 2694.97 – just outside the daily upper Bollinger band – followed by slight downward pressure in the subsequent sessions.
December-to-date, the bulls defended the 10-day twice. Seasonality is in their favor. With that said, it increasingly feels like they are already on board in expectation of a Santa rally.
The weekly chart flashed a doji.
Euro: Currently net long 86.2k, down 27.7k.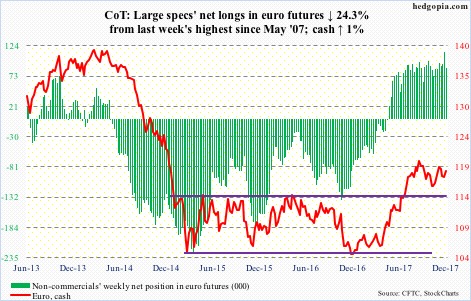
The bulls were able to build on last week’s defense of the 50-day, rallying the cash ($118.62) past both the 10- and 20-day. Although on Thursday, the currency faced resistance at a falling trend line from September 8 this year. Back then, it retreated after hitting $120.69. Resistance around that level goes back nearly two decades.
In order to go attack that resistance, the bulls first have to conquer the afore-mentioned trend line. Not to mention the daily upper Bollinger band, which lies at $119.28.
Gold: Currently net long 113.8k, up 6.7k.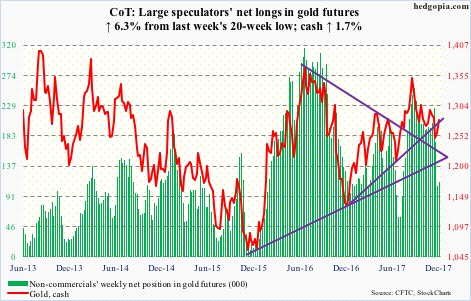
Medium-term, the odds of the cash ($1,278.80/ounce) continuing to attract bids have risen. A rising trend line from last December was lost last week, but turns out falsely. There is room to rally on the weekly chart.
On the daily, Friday’s 0.7-percent jump pushed the metal past both the 50- and 200-day. Resistance at $1,300 is stiff.
When it comes to flows, there is plenty of room for improvement. In the week to Wednesday, per ETF.com, IAU (iShares gold trust) attracted $59 million, but this was overshadowed by outflows of $333 million from GLD (SPDR gold ETF).
Nasdaq 100 index (mini): Currently net long 4k, down 2.6k.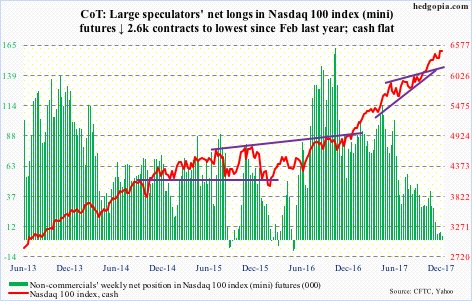
Yet another intraday high of 6522.70 on Monday, followed by slight downward pressure. The cash (6465.17) retreated from just outside the daily upper Bollinger band, with the lower band more than 200 points lower. In between lies tons of support, the nearest of which rests at 6430.
The bulls desperately need flows to improve and non-commercials to show some love.
QQQ (PowerShares QQQ trust) in the week through Wednesday lost $1.8 billion (courtesy of ETF.com). This comes on the heels of redemption of $1.2 billion in the prior three.
Russell 2000 mini-index: Currently net long 49.7k, up 8.3k.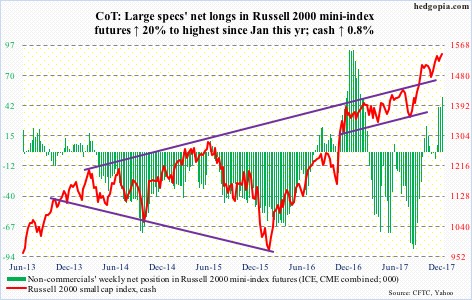
The cash (1542.93) continued to lag other major U.S. indices in that it was not able to rally to a new high this week. It peaked on the 4th this month at 1559.61. That said, Monday did produce a new closing high.
Small-caps’ relative underperformance contrasts with all the excitement surrounding the Tax Cuts and Jobs Act of 2017. These companies are domestically focused, and supposedly benefit more than their large-cap peers. Yet they are lagging. They did rally big post-election, though.
ETFs are experiencing outflows.
In the week through Wednesday, IWM (iShares Russell 2000 ETF) lost $1.1 billion, and IJR (iShares core S&P small-cap ETF) $19 million. In the prior week, they respectively lost $1.8 billion and $53 million (courtesy of ETF.com).
Non-commercials began to aggressively build net longs three weeks ago, but the cash has essentially gone sideways in the past four.
US Dollar Index: Currently net long 3.9k, up 9.6k.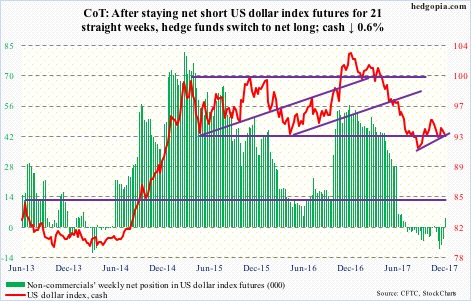
Range support at 92-93 was once again tested this week. It is a must-hold. The cash (92.92) is also approaching the daily lower Bollinger band (92.53).
The dollar index retreated this week after getting rejected at the 10-day on Monday. This was also a week in which U.S. interest rates came under decent upward pressure, but that was no help.
For a change, though, non-commercials went net long. Not big, but this follows 21 straight weeks of staying net short.
VIX: Currently net short 128.6k, up 6.5k.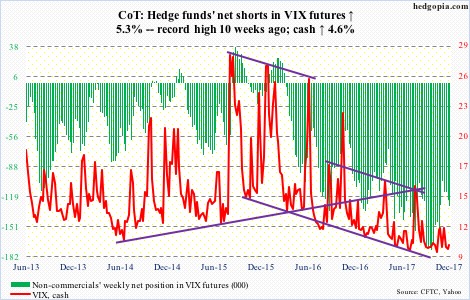
Wednesday, the cash (9.90) dropped intraday to 8.90 before rallying to close at 9.72. It was a hammer session, followed by Thursday’s long-legged doji. As much as this indicates indecision and potential for reversal, the bulls for a while now have consistently faced selling pressure as soon as volatility rises some. Too soon to say if it will be different this time, but signs of complacency continue to build up.
In the options market, the 21-day moving average of the CBOE put-to-call ratio on Thursday dropped to 0.572, which was the lowest since July 2014. In the last 25 sessions, the ratio registered readings of 0.50s in 17, with six in low-0.60s and two in mid- to high-0.60s.
In the meantime, the VIX-to-VXV ratio has remained languished in oversold territory in essentially the past four months.
Thanks for reading!
